Double top 'likely' confirmed – Five things to know in Bitcoin this week

Bitcoin (BTC $25,795) begins a key macro week in a weak place as 2023 BTC action begins to look like a “double top.”
After a disappointing weekly close below $26,000, BTC/USD is struggling to catch a bid amid a return to low volatility.
Analysts, already predicting downside, continue to forecast new local lows, and liquidity conditions are increasingly supporting their argument.
Are there any silver linings on the horizon? One on-chain metric suggests that Bitcoin is “in the midst” of a major shakeout akin to March 2020.
A rebound to “fair value” may also come courtesy of Bitcoin’s relative strength index (RSI), which has almost fully retraced its year-to-date gains to reach its lowest levels since the first week of January.
Cointelegraph takes a look at these topics and more in the weekly rundown of key BTC price triggers.
Weekly close makes BTC price double top a reality
Bitcoin closing out the week below key trendlines was already expected, but the reality may be worse than many care to admit.
That is the conclusion of popular trader and analyst Rekt Capital, who warned that a close below $26,000 would “likely” validate a double top structure on the BTC weekly chart.
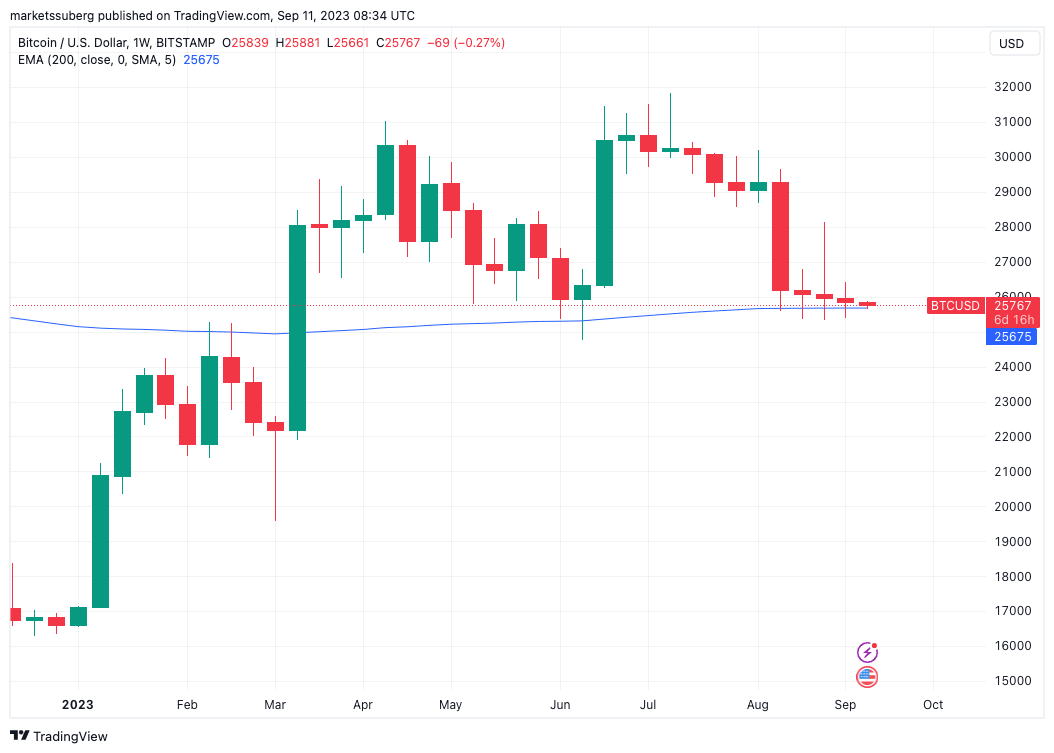
This currently takes the form of Bitcoin’s two 2023 local tops, both above $31,000, with a retracement to $26,000 inbetween, data from Cointelegraph Markets Pro and TradingView shows.
BTC price weakness now risks continuation downhill thanks to the latest close.
“Weekly close below ~$26,000 likely confirms the Double Top breakdown,” Rekt Capital wrote in part of an X post.
Further analysis noted that $26,000 had formed support for three weeks running, and that finally deciding its fate was thus significant on weekly timeframes.
With BTC/USD nonetheless seeing its lowest weekly close since March, popular chartist JT told X followers that there was still room for optimism. This, he argued, was in the form of the 200-week exponential moving average (EMA) near $25,600.
“This week candle was a spinning top doji, which is a candle that indicates indecision,” he wrote.
What’s quite remarkable though is that the past three weekly closes have closed within $400 of each other! Talk about boring and flat price action! The good news is we closed well above our weekly 200EMA ($25.6K).
BTC/USD 1-week chart with 200EMA. Source: TradingView
Cointelegraph previously covered the significance of the 200-week EMA within the current BTC price environment.
$20,000 futures gap next?
Bitcoin slowly heading lower has refueled a debate over its ability to repeat classic chart behavior.
This focuses on the largest cryptocurrency’s habit of “filling gaps” on CME futures markets, which appear on weekends and holidays.
Here, the difference in price between one week’s close and the next week’s open often forms a magnet for BTC price action in future — but not always immediately.
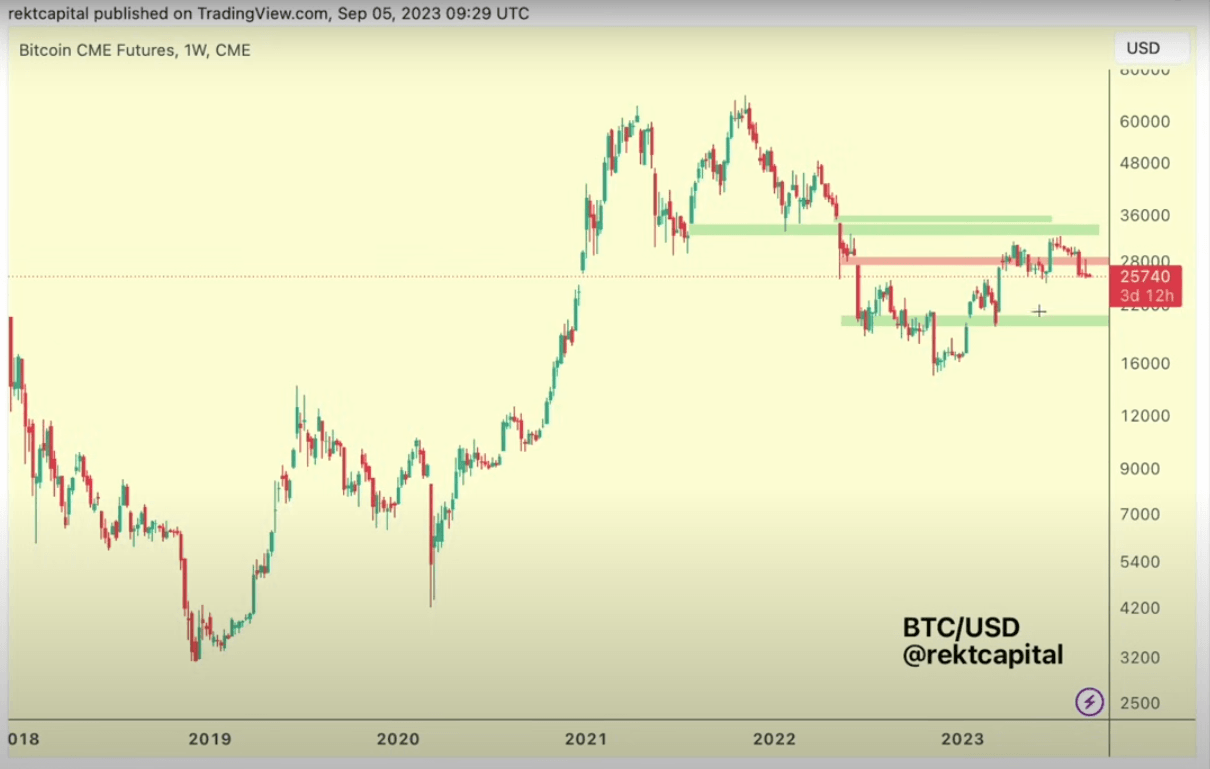
BTC/USD often “fills” gaps within days or even hours of futures markets resuming, but over time, some have been left behind. A major gap on the radar currently lurks at $20,000.
“That’s the only real CME gap that we have in terms of downside movement from current price levels,” Rekt Capital explained in his latest YouTube update on Sep. 6.
He continued by noting a now-filled gap from June 2022 was now acting as resistance after functioning as support and resistance at various points since its creation.
“This CME gap has been filled multiple times already and it’s been flipped into a new resistance,” he said, noting that the aforementioned double top completing would likewise feed into a return to the $20,000 zone.
Under such circumstances, a potential BTC price range would form, with the $20,000 gap and previously-filled gap functioning as support and resistance, respectively.
BTC/USD chart with CME gaps highlighted (screenshot). Source: Rekt Capital/YouTube
Others, however, were undecided about the probability of such a far-off gap being revisited.
“Bitcoin has a long history with CME futures Gaps. These Gaps tend to get filled sooner or later. But there's no guarantee they will,” popular trader Titan of Crypto argued.
Uploading a chart of historical gaps, he referenced another which is yet to fill, this time below $10,000.
“For some of you who are in crypto for quite some time, you may recall the $9.6k gap from September 2020. Back then everyone was expecting this gap to get filled so they can finally buy Bitcoin again. Guess what? It remains unfilled to this day and many got back in at $20k+, fomoing like crazy,” he wrote.
There is a gap that is still unfilled at $20k-$21k. Will it get filled? Well everything is possible. Yet until the market structure is broken, it's just wishful thinking.
BTC/USD annotated chart. Source: Titan of Crypto/X
Liquidity increases at March levels
Also feeding into bearish BTC price predictions is the general state of liquidity on BTC/USD markets.
Liquidity heatmaps are a common feature in crypto trading circles, helping to see where bid and ask concentrations lie and how these are manipulated by their owners.
Currently, a large block of bid liquidity is congregating around $24,000 — as Cointelegraph reported, the lowest such concentration since March.
“A a dip into that liquidity below looks a decent probability,” pseudonymous X user Honeybadger thus predicted, uploading one such heatmap.
In its latest heatmap release for largest-volume global exchange Binance, meanwhile, on-chain monitoring resource Material Indicators continued to flag $24,750 as a key level for bulls to retain.
“Whatever the case, bulls must defend the LL at $24,750 to hang on to any hopium of seeing another pump. Printing a new LL buys a ticket to Bearadise,” part of accompanying commentary stated.
CPI leads “huge” pre-FOMC week
After a quiet start to September, the macroeconomic landscape is returning as a potential source of risk asset volatility.
This week, the United States Consumer Price Index (CPI) August print forms the focus ahead of a key interest rate decision by the Federal Reserve.
“Huge last week before the September Fed meeting,” financial commentary resource The Kobeissi Letter wrote in part of preliminary commentary, noting that “lots of volatility” lies ahead.
Due on Sep. 14, CPI is well known as a volatility catalyst for BTC price action, but recent prints have failed to alter the status quo for long.
Crypto market participants nonetheless include its release in their roadmaps, while the figures are apt to impact market expectations of what the Fed will do to benchmark interest rates.
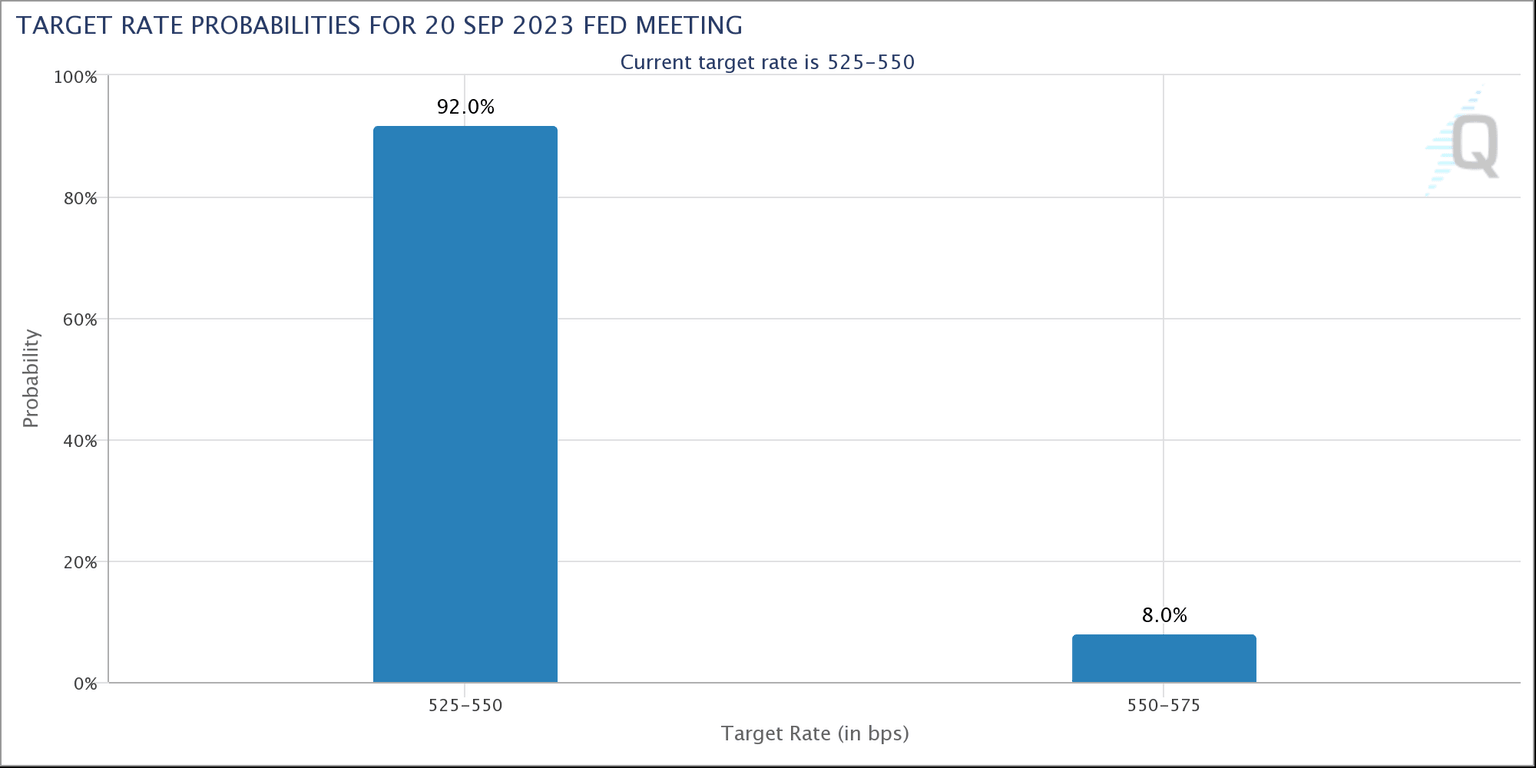
Its next decision will come on Sep. 20, and according to CME Group’s FedWatch Tool, confidence is high that rates will remain unchanged — a potential boon to risk assets, including crypto.
As of Sep. 11, the odds of a pause in hikes were over 90%.
Fed target rate probabilities chart. Source: CME Group
Back to March 2020
As Cointelegraph reported at the weekend, one on-chain metric is signaling that current BTC price action may be more significant than traders believe.
Related: Bitcoin all-time high in 2025? BTC price idea reveals ‘bull run launch’
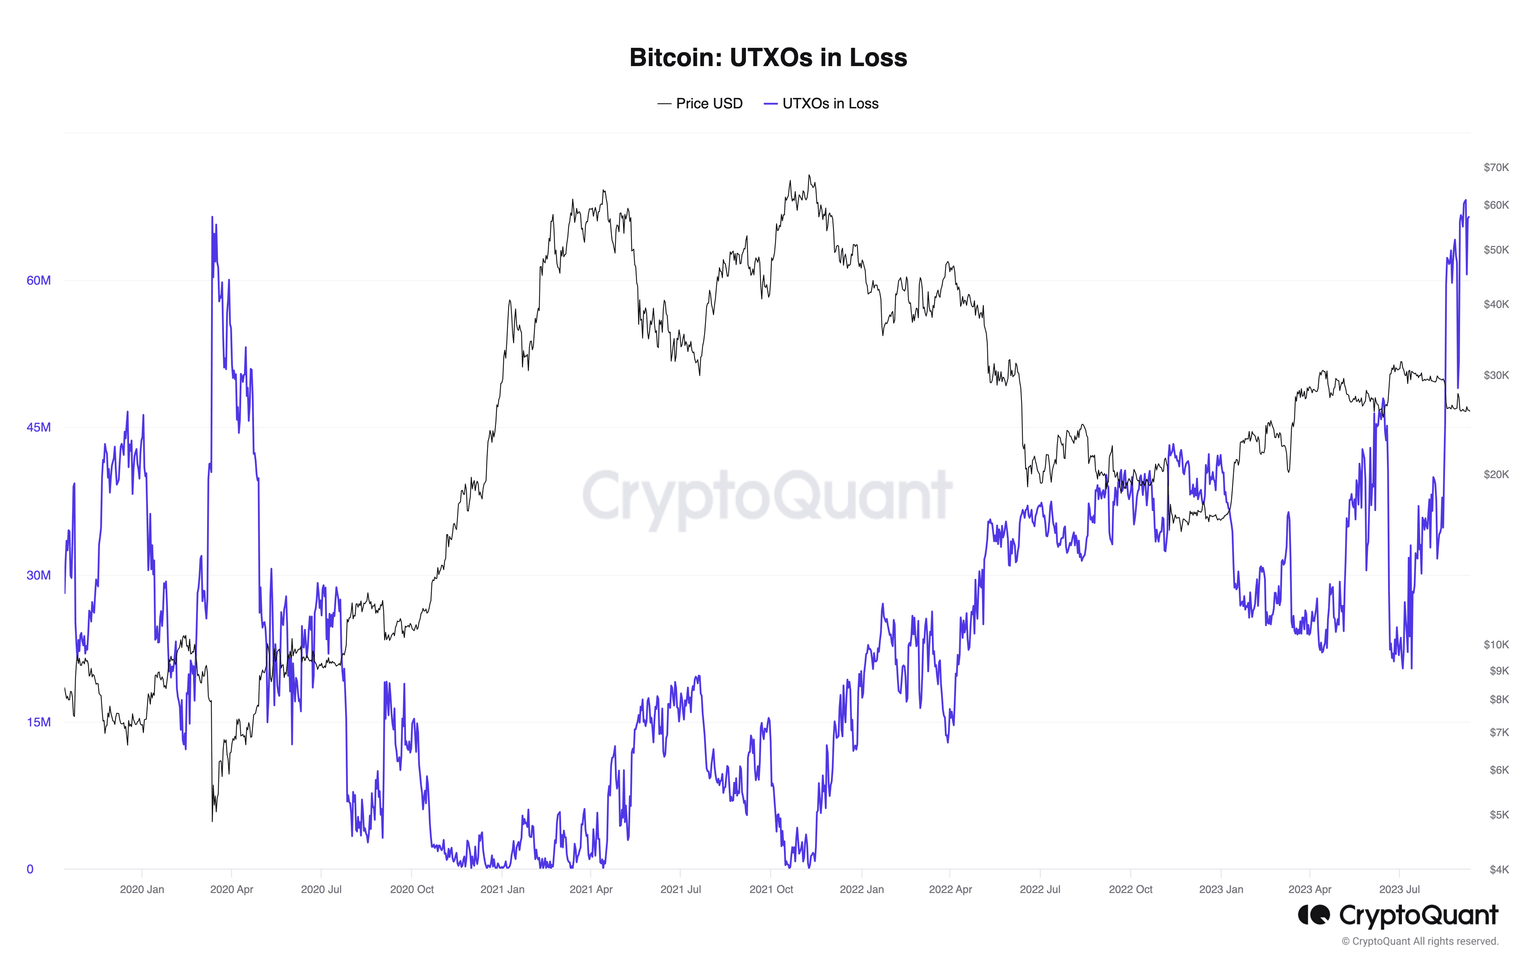
UTXOs in Loss, which measures the number of unspent transaction outputs (UTXOs) from on-chain transactions worth less than they were at the time of purchase, are at their highest since March 2020.
As noted by on-chain analytics firm Glassnode, UTXOs in Loss does not measure the amount of BTC in loss, but rather the number of UTXOs involved.
A research update from on-chain analytics platform CryptoQuant nonetheless warned that Bitcoin may be dealing with a “black swan” event similar to that which sent BTC price down 60% over three years ago.
“Given that the current level of the ‘UTXOs in loss’ indicator mirrors that of the Black Swan event between March and April 2020 (due to the Coronavirus), those anticipating another Black Swan event might want to consider whether we are already in the midst of the event they are waiting for,” its author, CryptoQuant contributor Woominkyu, wrote.
Bitcoin UTXOs in Loss chart. Source: CryptoQuant
Author

Cointelegraph Team
Cointelegraph
We are privileged enough to work with the best and brightest in Bitcoin.


