- Polkadot price action flirts with a new low for 2022.
- DOT trades near the oversold area in the Relative Strength Index, limiting further downside.
- Except to see a quick and steep recovery towards the end of the year.
Polkadot (DOT) price slumps again, this time by flirting with the low of 2022 at $4.41. Although this looks bearish with a few technical elements, DOT bears could be nearing the end as a turnaround is just around the corner. As trading volumes start to wear thin, a price reversal is nearby as the Relative Strength Index (RSI) is already trading in the oversold area.
Polkadot sees bears ready to get off the train
Polkadot has seen a sharp decline since its recovery in November. With a 37% fall in just four weeks, adding a new low for 2022 does not build a good case for DOT to be bought immediately. Add the break below the monthly S1 at $4.50 and the firm rejection on the topside on Thursday morning during the ASIA PAC session, and it rationally points to more lows. A turnaround could, however, be in the cards very soon.
DOT is currently seeing bears stretch this selloff as the RSI is trading near the oversold area and has already been trading across in the previous days. This means a minor new low for 2022 can be printed, and a sharp swing back up should be possible. Expect to see price action quickly spike up to $5 on thin volumes and should the US Dollar weaken further.
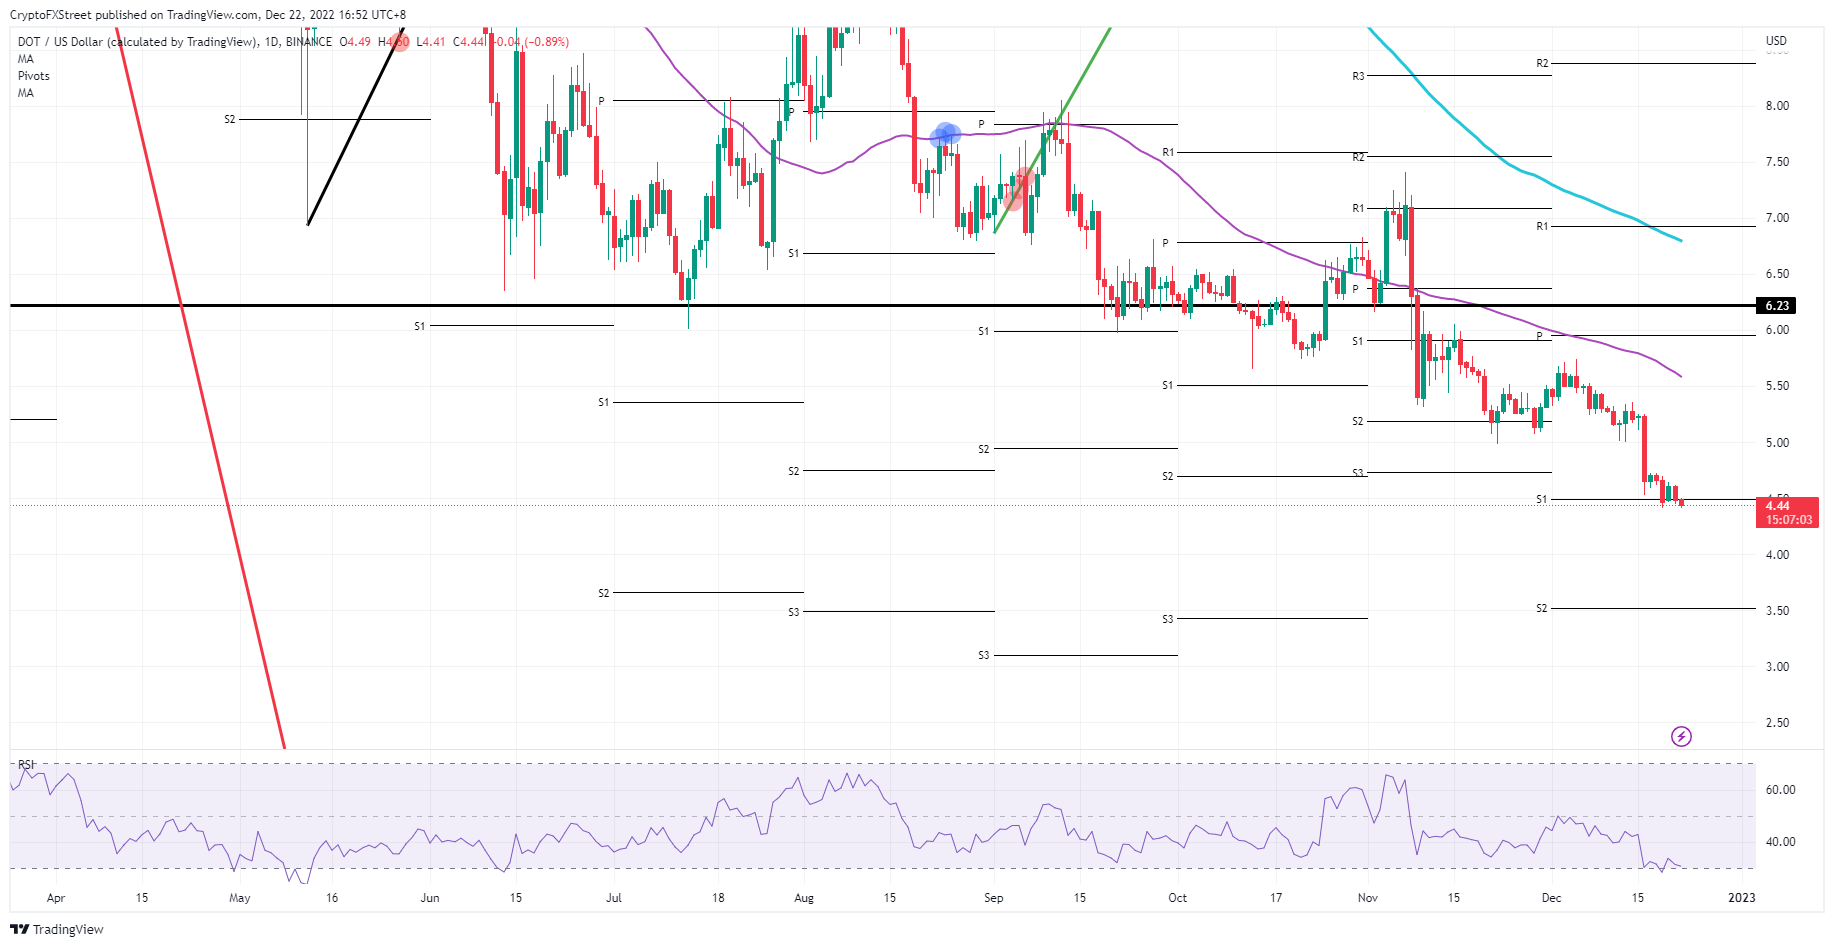
DOT/USD daily chart
The risk of more downside comes with that thin volume, as Polkadot bears could stick to their guns and not start buying to make a profit. In that case, expect a further decline towards $3.50 near the monthly S2 support level. That would provide the support needed to halt the decline for now.
Information on these pages contains forward-looking statements that involve risks and uncertainties. Markets and instruments profiled on this page are for informational purposes only and should not in any way come across as a recommendation to buy or sell in these assets. You should do your own thorough research before making any investment decisions. FXStreet does not in any way guarantee that this information is free from mistakes, errors, or material misstatements. It also does not guarantee that this information is of a timely nature. Investing in Open Markets involves a great deal of risk, including the loss of all or a portion of your investment, as well as emotional distress. All risks, losses and costs associated with investing, including total loss of principal, are your responsibility. The views and opinions expressed in this article are those of the authors and do not necessarily reflect the official policy or position of FXStreet nor its advertisers. The author will not be held responsible for information that is found at the end of links posted on this page.
If not otherwise explicitly mentioned in the body of the article, at the time of writing, the author has no position in any stock mentioned in this article and no business relationship with any company mentioned. The author has not received compensation for writing this article, other than from FXStreet.
FXStreet and the author do not provide personalized recommendations. The author makes no representations as to the accuracy, completeness, or suitability of this information. FXStreet and the author will not be liable for any errors, omissions or any losses, injuries or damages arising from this information and its display or use. Errors and omissions excepted.
The author and FXStreet are not registered investment advisors and nothing in this article is intended to be investment advice.
Recommended Content
Editors’ Picks

Litecoin Price Prediction: LTC tries to retake $100 resistance as miners halt sell-off
Litecoin price grazed 105 mark on Monday, rebounding 22% from the one-month low of $87 recorded during last week’s market crash. On-chain data shows sell pressure among LTC miners has subsided. Is the bottom in?

Bitcoin fails to recover as Metaplanet buys the dip
Bitcoin price struggles around $95,000 after erasing gains from Friday’s relief rally over the weekend. Bitcoin’s weekly price chart posts the first major decline since President-elect Donald Trump’s win in November.

SEC Commissioner Hester Pierce sheds light on Ethereum ETF staking under new administration
In a Friday interview with Coinage, SEC Commissioner Hester Peirce discussed her optimism about upcoming regulatory changes as the agency transitions to new leadership under President Trump’s pick for new Chair, Paul Atkins.

Bitcoin dives 3% from its recent all-time high, is this the cycle top?
Bitcoin investors panicked after the Fed's hawkish rate cut decision, hitting the market with high selling pressure. Bitcoin's four-year market cycle pattern indicates that the recent correction could be temporary.
Bitcoin: 2025 outlook brightens on expectations of US pro-crypto policy
Bitcoin price has surged more than 140% in 2024, reaching the $100K milestone in early December. The rally was driven by the launch of Bitcoin Spot ETFs in January and the reduced supply following the fourth halving event in April.

Best Forex Brokers with Low Spreads
VERIFIED Low spreads are crucial for reducing trading costs. Explore top Forex brokers offering competitive spreads and high leverage. Compare options for EUR/USD, GBP/USD, USD/JPY, and Gold.