Dogecoin price triggers a multi-year breakout as DOGE bulls hint at a revisit of $0.190
- Dogecoin price has produced a massive move above a declining trend line stretching back to May 2021.
- This breakout will be confirmed on the weekly close and could kick-start a massive bull run for DOGE.
- A weekly candlestick close below $0.0586 will create a lower low and invalidate the bullish thesis.

Dogecoin price shows a clear surge in bullish momentum after months of trading lower and consolidating in a tight range. This explosive move has the potential to propel the dog-themed crypto higher, but investors need to wait for a confirmation that will arrive after a weekly candlestick close.
A successful breakout above the immediate hurdle will be a key signal for DOGE holders to expect impressive returns.
Dogecoin price ready to rock
Dogecoin price has been attempting to break above the declining trend line connecting a slew of lower highs formed since May 2021. Despite multiple attempts that seemed promising, all failed to pull through, resulting in a swift sell-off.
The most recent attempt, however, occurring while Bitcoin has also flipped bullish after weeks of tight consolidation. Hence, the chances of a successful breakout are higher. Investors need to wait for pullbacks to accumulate until a weekly confirmation arrives.
After a weekly candlestick close above this trend line, market participants can expect Dogecoin price to sweep equal highs at $0.089. In a highly bullish case, DOGE could try to retest and flip the $0.1099 hurdle into a support floor.
The ideal place to book profits would be $0.190, which is the midpoint of the 93% crash seen between May 3 and June 13.
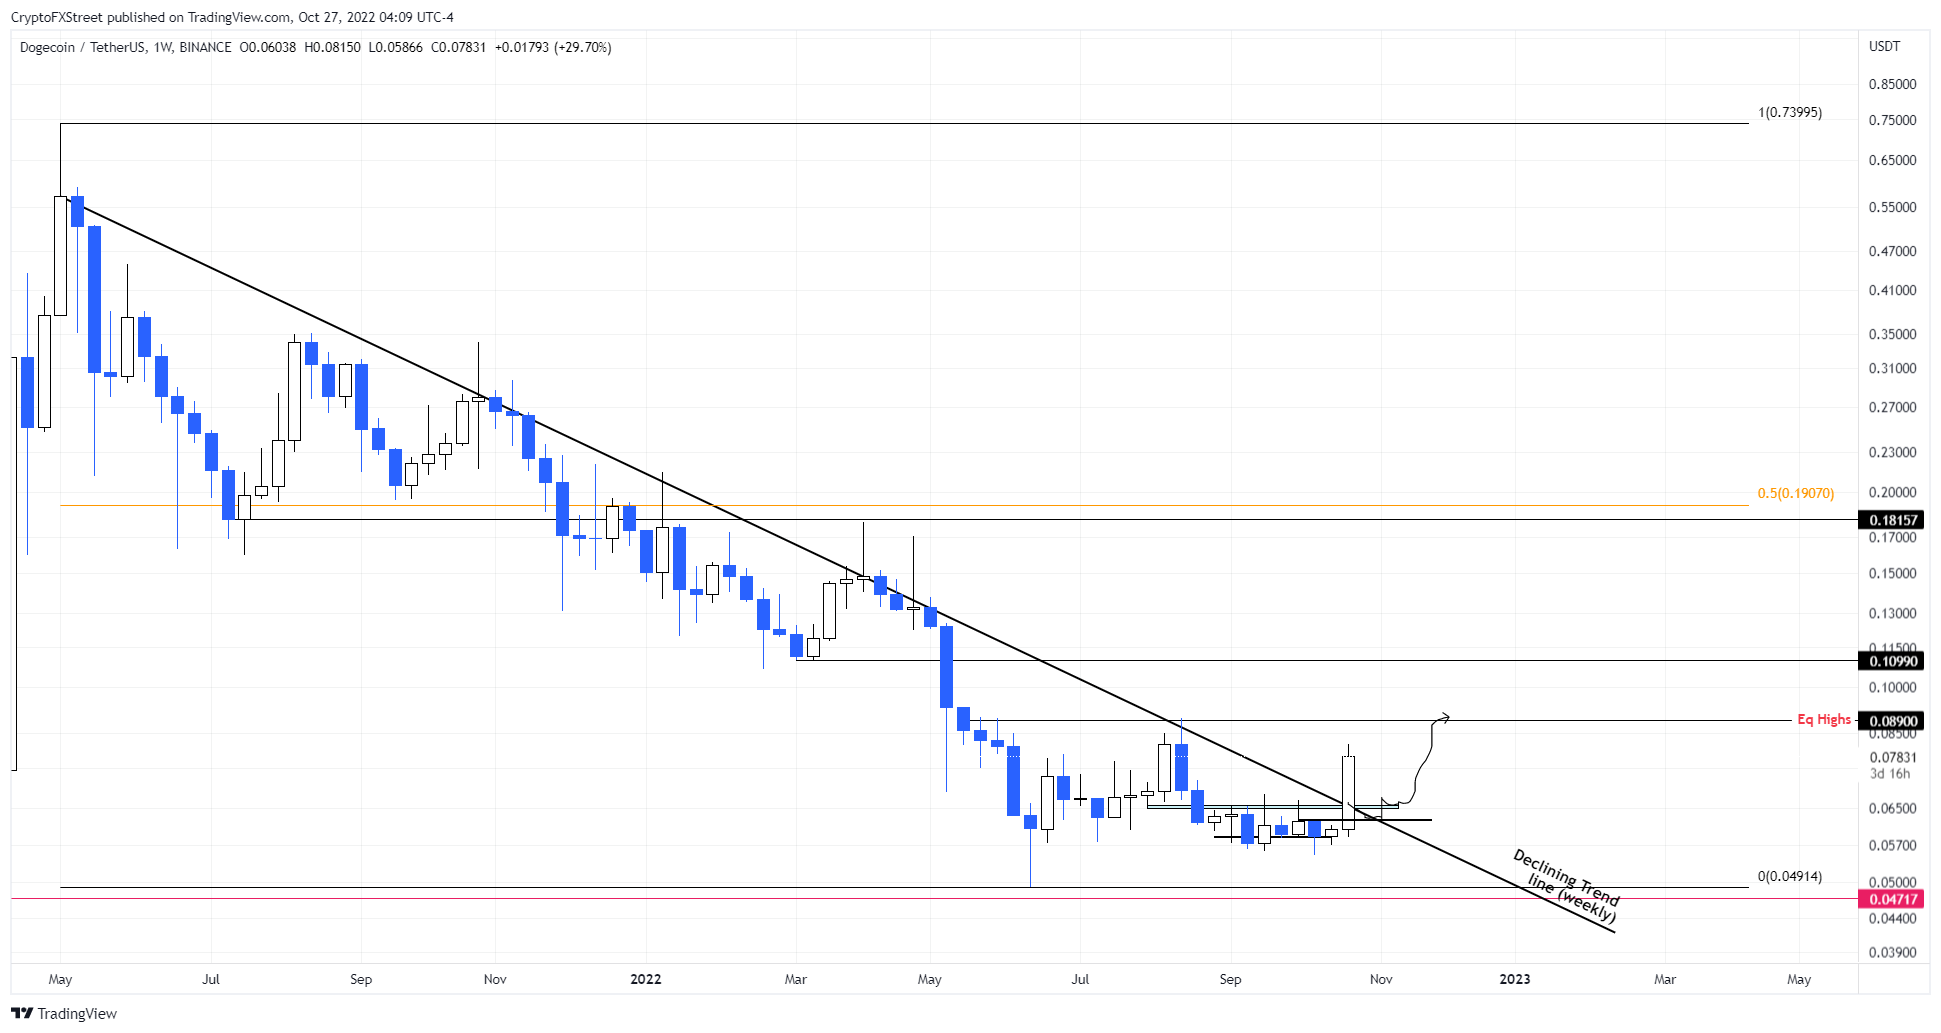
DOGEUSDT 1-week chart
While the weekly chart does show a bullish outlook, a relatively lower time frame shows that Dogecoin price has already produced a daily candlestick close above this declining trend line. While this development is bullish, no doubt, investors need to observe the attempts made in April and May 2022.
A pullback could see the dog-themed crypto retest the declining trend line, which also coincides with another support level at $0.062. Alternatively, the 100-day Exponential Moving Average (EMA) at $0.066, slightly higher, nearly coincides with the $0.066 support area, making it another ideal place for accumulating DOGE at a discount.
These levels are ideal for dollar-cost averaging into DOGE in anticipation of the next run-up.
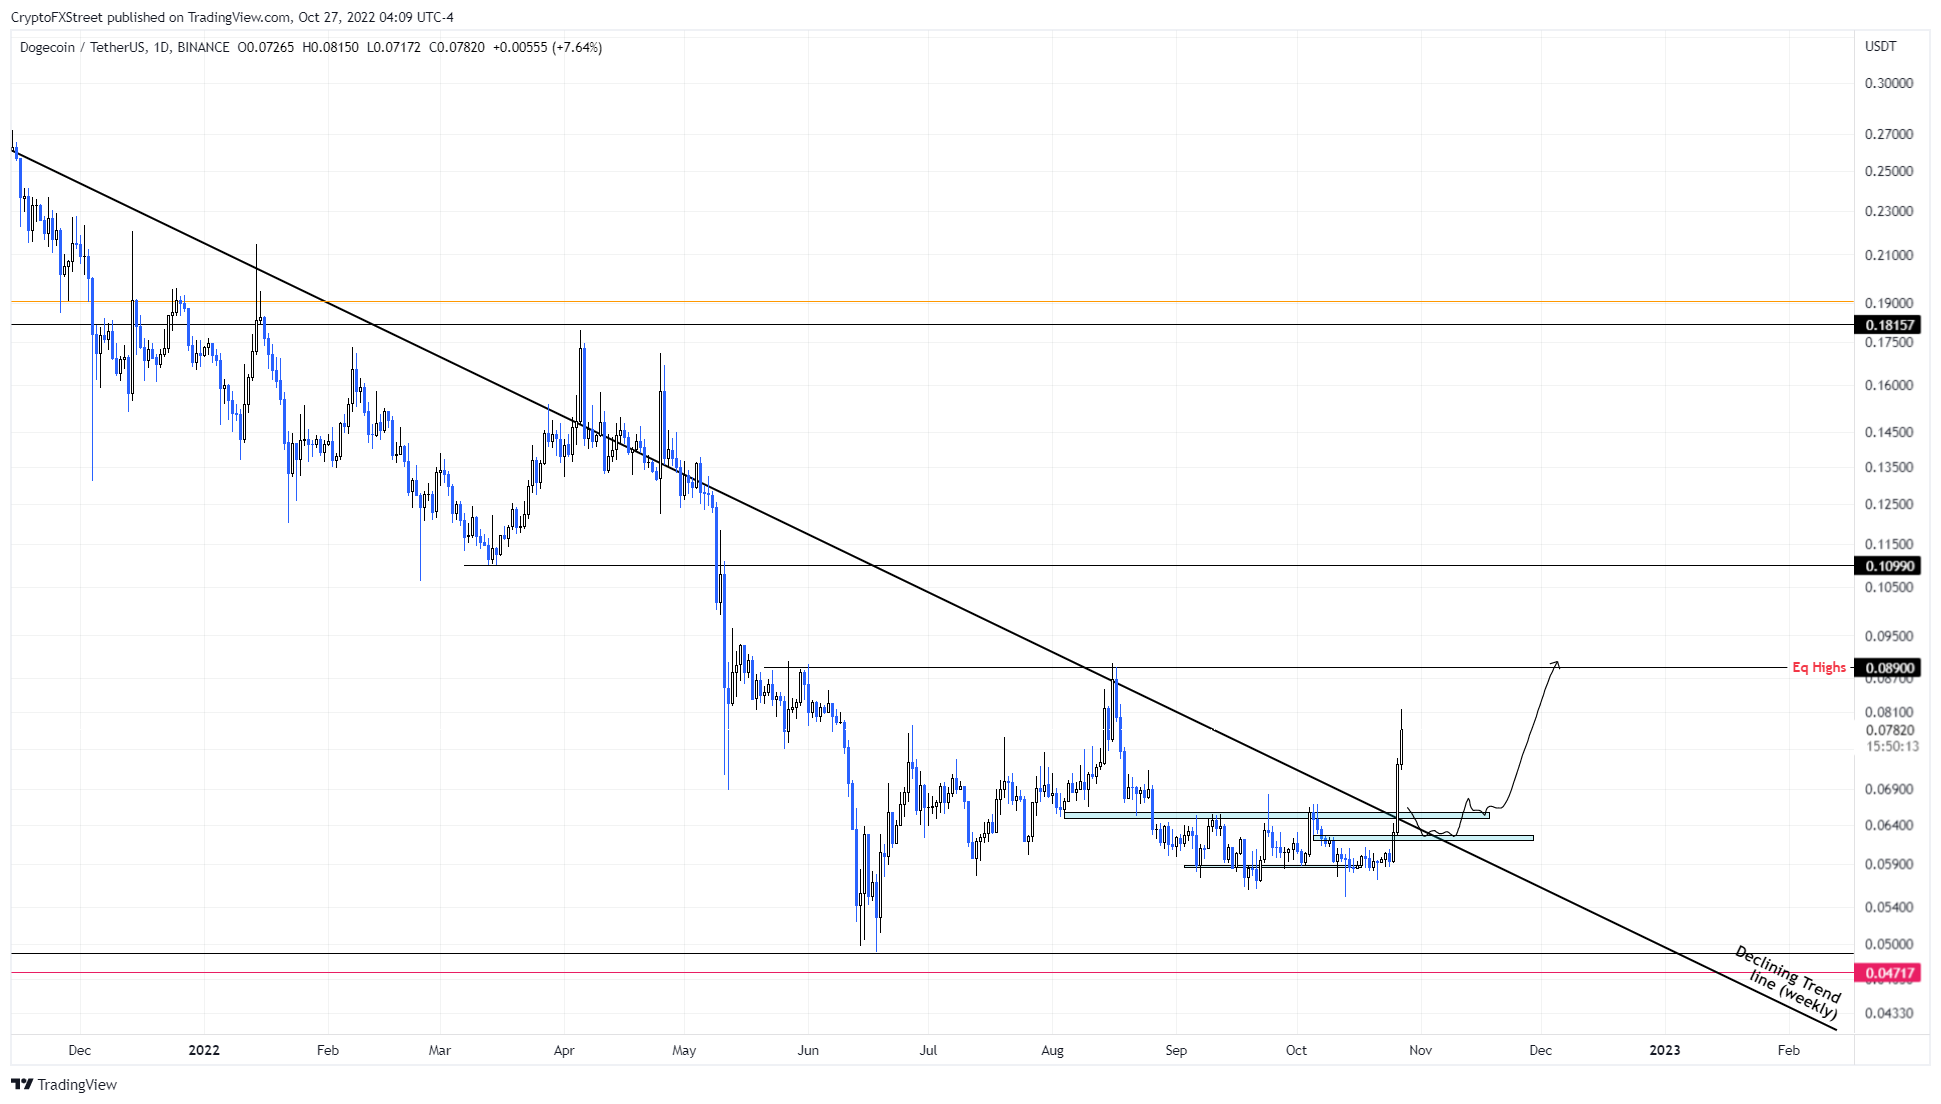
DOGEUSDT 1-day chart
While things are looking up for Dogecoin price, a reentry below the multi-year declining trend line would indicate a weakness among buyers. Furthermore, if DOGE produces a weekly candlestick close below the $0.0586 support cluster, it will create a lower low and invalidate the bullish thesis.
This development could see Dogecoin price revisit the $0.049 foothold.
Author

Akash Girimath
FXStreet
Akash Girimath is a Mechanical Engineer interested in the chaos of the financial markets. Trying to make sense of this convoluted yet fascinating space, he switched his engineering job to become a crypto reporter and analyst.


