Dogecoin Price Prediction: DOGE awaits 36% breakout from consolidation
- Dogecoin price is consolidating inside a symmetrical triangle pattern.
- The MACD indicator has presented a bullish crossover, suggesting a mildly bullish bias for DOGE.
- A breach of $0.061 could serve as the uptrend's initial confirmation.

The Dogecoin price has been moving sideways inside a technical formation with no inherent bias. A move out of this setup could result in a highly volatile action.
Dogecoin price between rock and hard place
The Dogecoin price has formed lower highs and higher lows since February 18. By drawing trend lines along with these swing points, a symmetrical triangle seems to form.
This pattern’s breakout will result in a 36% move, determined by measuring the distance between the swing high and low at the broadest part of the setup.
Since this technical formation has no inherent bias, an uptrend will evolve if DOGE slices through the upper trend line around $0.061. Secondary confirmation of this uptrend will arrive if the Dogecoin price closes above $0.063 on the 12-hour chart.
Likewise, a breakdown of the setup’s lower boundary around $0.047 will confirm the start of a new downtrend and result in a crash to $0.033.
However, the Moving Average Convergence Divergence (MACD) indicator presented a bullish crossover since the MACD line (blue) moved above the signal line (orange) recently. Such an advance suggests an overall positive outlook for DOGE.
A spike in bullish momentum that pushes the Dogecoin price above the upper trend line at $0.061 will cement the meme coin’s bullish nature. In this case, DOGE is likely to head toward $0.083, which is a 36% upswing.
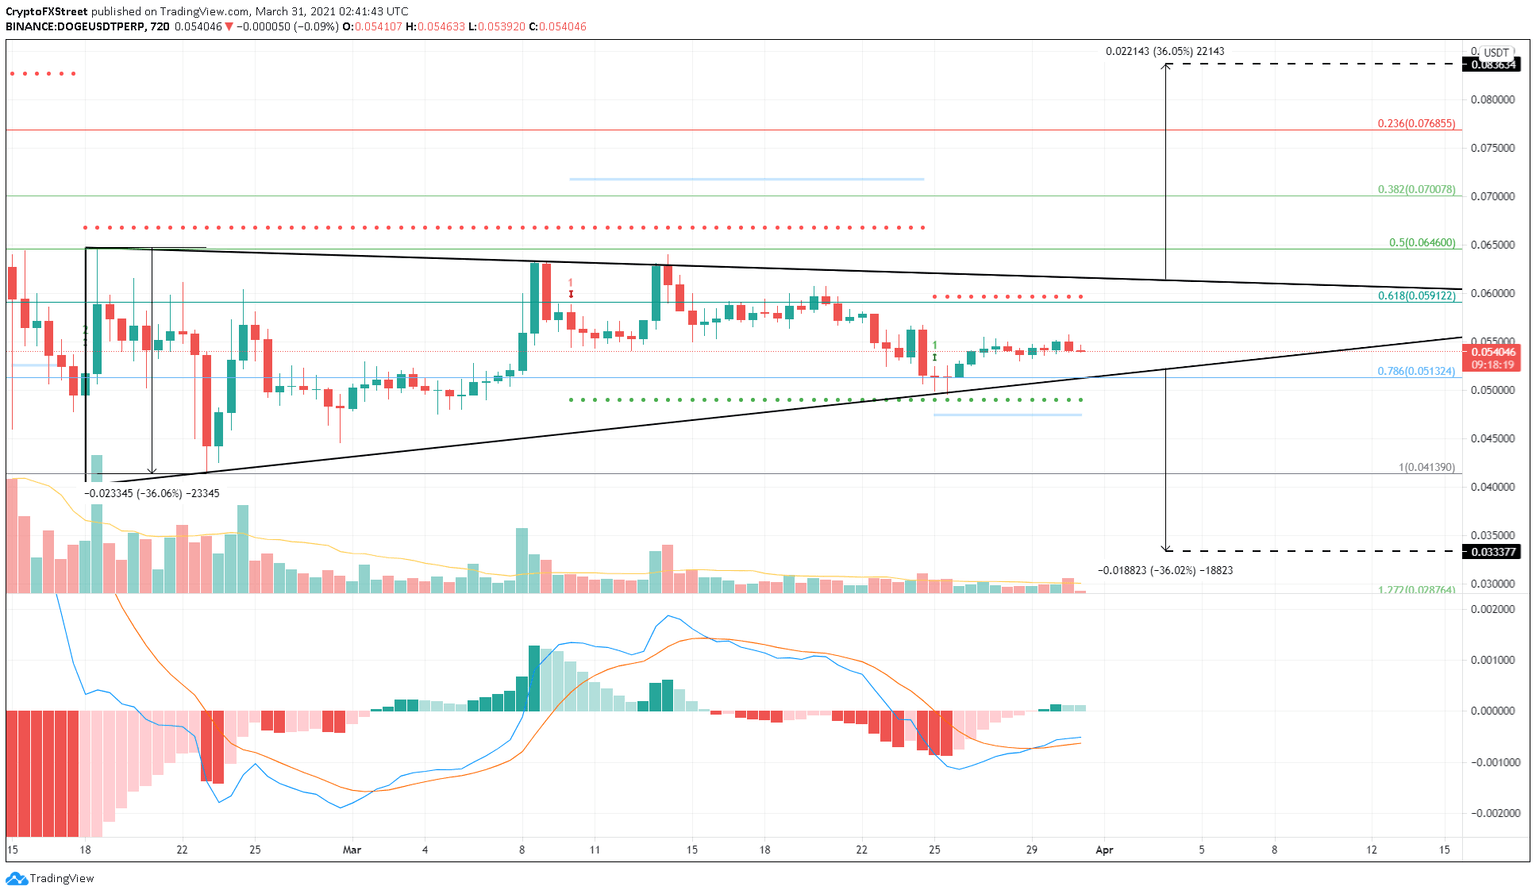
DOGE/USDT 12-hour chart
IntoTheBlock’s In/Out of the Money Around Price (IOMAP) model shows that the Dogecoin price is present between a stable support barrier at $0.053 and a cluster of resistance levels ranging from $0.054 to $0.058.
Nearly 100,000 addresses purchased 12 billion DOGE at an average price of $0.053. However, 285,000 addresses that previously purchased 21 billion DOGE tokens between $0.054 and $0.058 are “Out of the Money.”
Hence, a volatile move, especially to the upside, will not occur until these levels are breached convincingly.
A spike in bullish pressure is crucial for the uptrend since DOGE needs to overcome the underwater investors who might want to break-even.
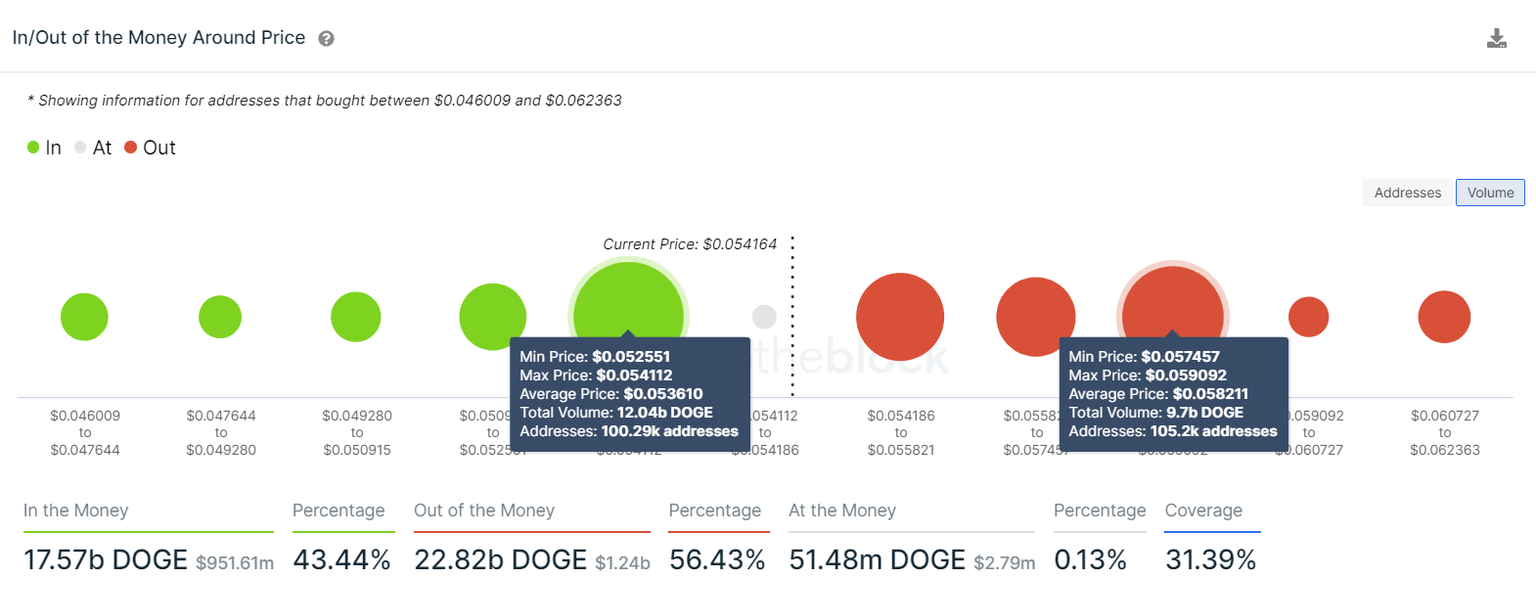
Dogecoin IOMAP chart
Regardless, if the Dogecoin price slices through the lower trend line around $0.047, it will invalidate the bullish thesis and confirm a downtrend. If the bearish momentum persists, DOGE could slide 20% to the immediate support level at $0.043.
It would be fatal for the meme coin if $0.043 is breached. This move might extend the crash by another 20% to $0.033.
Author

Akash Girimath
FXStreet
Akash Girimath is a Mechanical Engineer interested in the chaos of the financial markets. Trying to make sense of this convoluted yet fascinating space, he switched his engineering job to become a crypto reporter and analyst.


