Dogecoin Price Prediction: DOGE at risk of a 60% downswing if vital support fails to hold


  • Dogecoin bulls are tasked with defending $0.03 support to avert a potentially massive breakdown.
  • DOGE is dealing with massive seller congestion zones ahead that could delay recovery.
  • The downtrend could be sabotaged if Dogecoin sustains an hourly candlestick above the 100 SMA.

Dogecoin recovery has become an uphill task after plunging from $0.088. The bearish outlook has also remained unchallenged over the last couple of days, as reported. Meanwhile, the 'Meme Coin' is exchanging hands at $0.032 amid the bulls' intensive fight to hold above $0.030.

Dogecoin critical support in jeopardy as technicals flip bearish

Slightly above the prevailing market value, Dogecoin is facing acute resistance under the 100 Simple Moving Average. It is essential to note that the token is also trading below the 50 SMA on the 1-hour chart, significantly increasing overhead pressure.

The most significant technical development is the formation of a symmetrical triangle pattern. This type of triangle can be described as a volatility-contraction pattern. In other words, it marks a decrease in an asset's volatility. The triangle also signifies a potential breakout or breakdown.

A breakout occurs after the price hits levels above the upper trendline. Similarly, a breakdown takes place when the price crosses below the lower trendline. Note that the triangle has an exact target that can be used as a stop loss, measured from the highest to the lowest point of the pattern.

If DOGE loses the support at $0.030, a 60% breakdown could come into play, forcing Dogecoin to explore lower price levels toward $0.0138. Investors still holding Dogecoin are probably worried that the bottom yet to be found. Therefore, declines under $0.030 could trigger panic-selling.

DOGE price chart

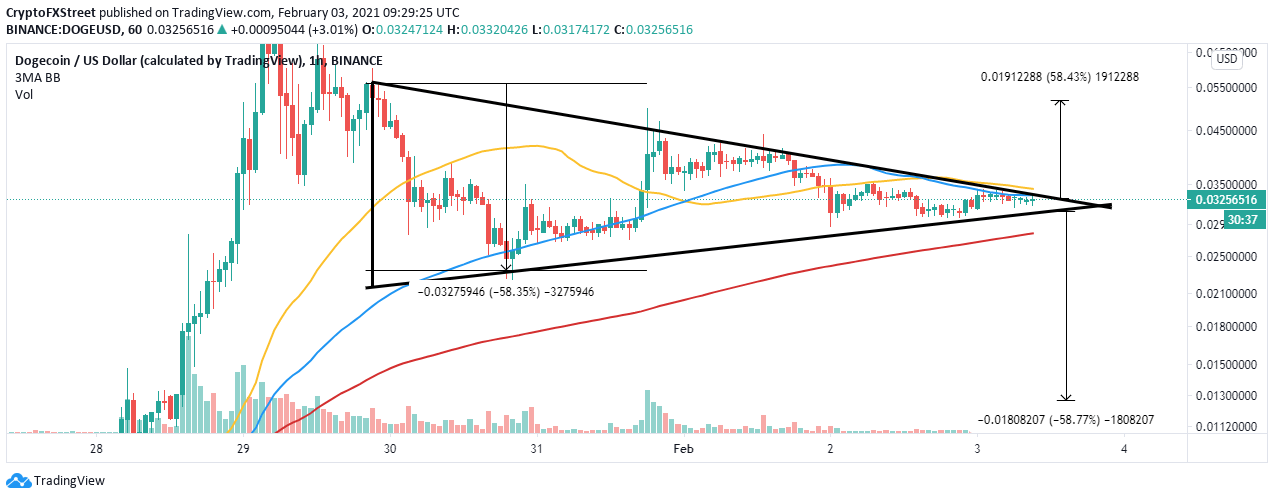
DOGE/USD 1-hour chart

The IOMAP model by IntoTheBlock confirms that recovery will not come easy based on the robust seller congestion zones ahead. The largest hurdle runs from $0.036 to $0.037. Here, nearly 29,000 addresses had previously bought about 2.8 billion DOGE.

Dogecoin IOMAP model

Dogecoin IOMAP model

The same IOMAP model highlights the key support, $0.0315 to $0.0324. Roughly 23,000 addresses are currently profiting from the approximately 7.6 billion DOGE formerly purchased in the range. Buyers must hold above this critical zone; otherwise, Dogecoin could dive downstream.

Looking at the other side of the picture

As mentioned above, the symmetrical triangle can result in an upswing if Dogecoin breaks above the upper trendline. However, DOGE must jump above the 100 SMA to sustain an uptrend. Besides, crossing beyond the 50 SMA would call out to buyers to join the market, in turn, pushing Dogecoin toward $0.055.


Information on these pages contains forward-looking statements that involve risks and uncertainties. Markets and instruments profiled on this page are for informational purposes only and should not in any way come across as a recommendation to buy or sell in these assets. You should do your own thorough research before making any investment decisions. FXStreet does not in any way guarantee that this information is free from mistakes, errors, or material misstatements. It also does not guarantee that this information is of a timely nature. Investing in Open Markets involves a great deal of risk, including the loss of all or a portion of your investment, as well as emotional distress. All risks, losses and costs associated with investing, including total loss of principal, are your responsibility. The views and opinions expressed in this article are those of the authors and do not necessarily reflect the official policy or position of FXStreet nor its advertisers. The author will not be held responsible for information that is found at the end of links posted on this page.

If not otherwise explicitly mentioned in the body of the article, at the time of writing, the author has no position in any stock mentioned in this article and no business relationship with any company mentioned. The author has not received compensation for writing this article, other than from FXStreet.

FXStreet and the author do not provide personalized recommendations. The author makes no representations as to the accuracy, completeness, or suitability of this information. FXStreet and the author will not be liable for any errors, omissions or any losses, injuries or damages arising from this information and its display or use. Errors and omissions excepted.

The author and FXStreet are not registered investment advisors and nothing in this article is intended to be investment advice.

Join Telegram

Recommended content


Recommended Content

Editors’ Picks

Ripple on-chain metrics show bullish signs amidst legal struggle with SEC, XRP eyes recovery

Ripple on-chain metrics show bullish signs amidst legal struggle with SEC, XRP eyes recovery

Ripple made a comeback above $0.48 on Tuesday and hovers above that level in Wednesday’s European session. Ripple on-chain metrics such as transaction volume and Network Realized Profit/Loss have turned bullish, supporting a recovery in the altcoin. 

More Ripple News

Bitcoin price falls amidst German government transfers, miners activity

Bitcoin price falls amidst German government transfers, miners activity

Bitcoin (BTC) extends correction on Wednesday and hovers around $61,000 after finding resistance near the $64,000 level on Monday. Recent on-chain data indicates heightened selling activity from Bitcoin miners early in the week. 

More Bitcoin News

Crypto Today: Bitcoin erases gains from end of June, Ethereum declines while Ripple holds

Crypto Today: Bitcoin erases gains from end of June, Ethereum declines while Ripple holds

Bitcoin wipes out gains from the last week of June and falls below $60,000 on Wednesday. Ethereum and top altcoins ranked by market capitalization erased gains as the inflation outlook worsened. Ripple holds on to recent gains and hovers above $0.48 on Wednesday. 

More Cryptocurrencies News

Three reasons why altcoins could shake off losses this week

Three reasons why altcoins could shake off losses this week

On-chain data from Santiment shows that altcoins are currently in the opportunity zone, or generating buy signals. The top three altcoins in the buy zone are Basic Attention Token (BAT), Chromia (CHR), and Highstreet (HIGH), per Santiment. 

More Altcoins News

Bitcoin: BTC price correction could end in July, according to seasonal data

Bitcoin: BTC price correction could end in July, according to seasonal data

Bitcoin (BTC) price appears poised for a decline this week, influenced by slight outflows in US spot ETFs, selling activity among BTC miners, and a combined transfer of 4,690.28 BTC to centralized exchanges by the US and German governments.

Read full analysis

BTC

ETH

XRP