Dogecoin price looks to recapture $0.35 if DOGE bulls take out this critical level


  • Dogecoin price sees renewed buying interest, as a new week kicks in.
  • DOGE bulls battle 21-DMA within a falling wedge formation on the 1D chart.
  • 100-DMA continues to guard the downside amid bullish RSI.

Amid the growing market’s criticism over the centralization of DOGE's supply, the canine-theme-inspired cryptocurrency is attempting to find its feet after the previous week’s sell-off to two-week lows of $0.2661.

Dogecoin price kicks off a brand-new week on a positive note, consolidating Friday’s swift rebound around the $0.29 region, as bulls return this Sunday. Markets viewed Fed Chair Jerome Powell’s Jackson Hole address as not hawkish enough, which fueled a fresh upswing in cryptos on Friday.

Meanwhile, for DOGE price, the recent dry spell of celebrity endorsements has kept buyers on the sidelines. However, with Bitcoin re-attempting the $50,000 threshold, DOGE bulls are trying their luck once again.

The seventh most widely traded coin lost 8% over the last seven days, now adding 1.50% on the day after registering two straight weekly losses.

DOGE/USD: A sustained move above 21-DMA to revive bullish interests

The meme-coin has been forming lower highs and lower lows on the daily chart ever since it peaked at $0.3552 on August 16. This price action in Dogecoin has carved a falling wedge formation, which is usually considered as a bullish continuation pattern.

DOGE bulls need to crack the falling trendline resistance at $0.3127 to yield an upside breakout from the wedge. The buyers will then keep their sight on the $0.35 round figure.

However, for any upside attempts to sustain, DOGE price has to deliver a daily closing above the upwards-loping 21-Daily Moving Average (DMA) at $0.2954, which is currently checking the buying resurgence.

The 14-day Relative Strength Index (RSI) is trading flattish while sitting just above 50.00, lending some support to DOGE bulls.

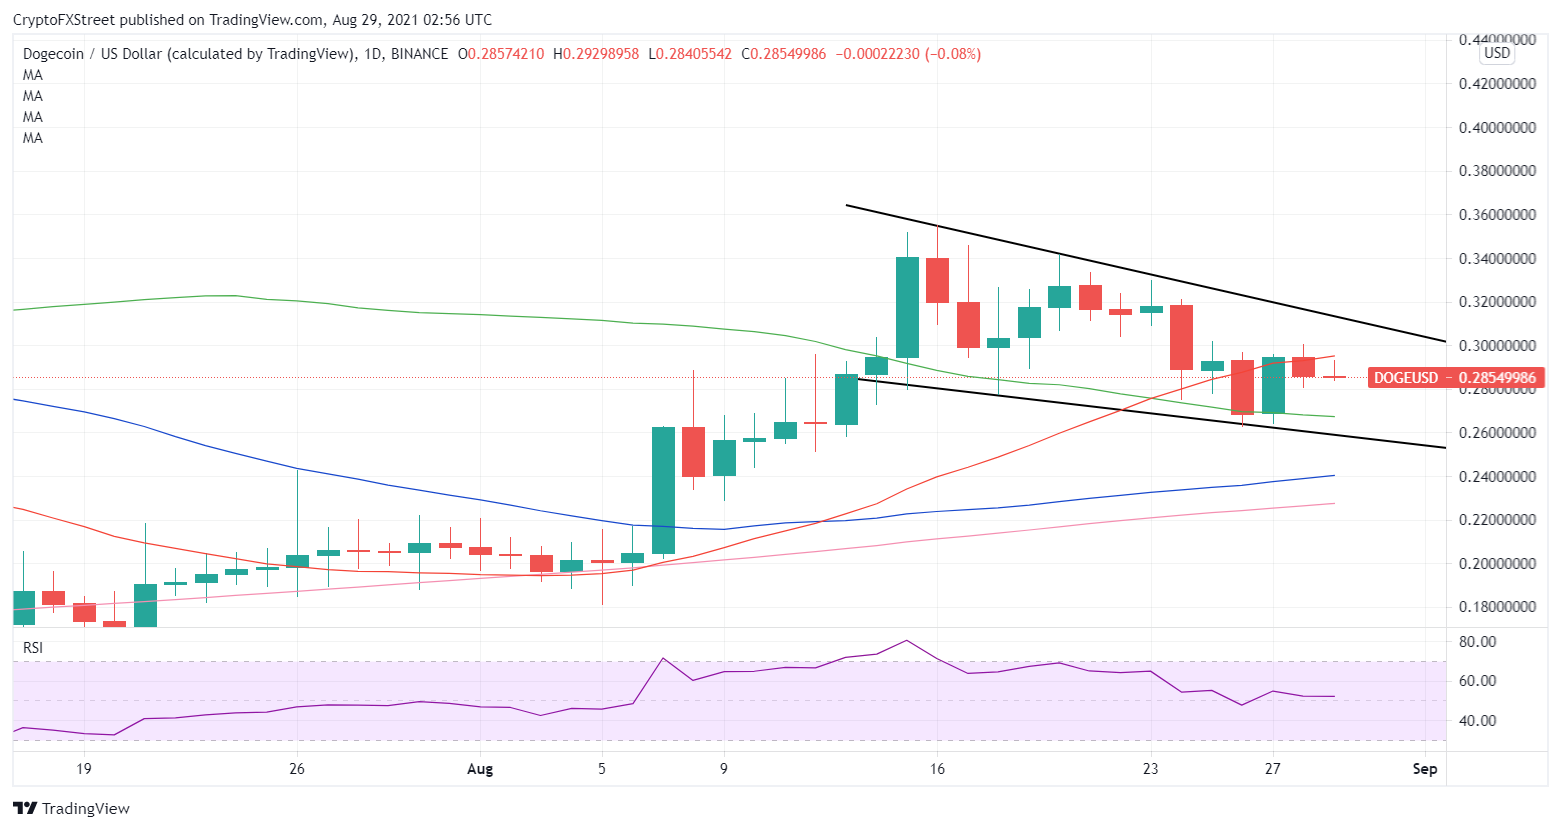
DOGE/USD: Daily chart

Any pullbacks will meet initial demand at $0.2672, where the bearish 100-DMA aligns. Note that the price hasn’t yielded a daily closing below the 100-DMA support line since August 14.  

Additional downward pressure could put the falling trendline (wedge) support at $0.2590 at risk.

A sustained move below the latter is likely to open the downside towards the mildly bullish 50-DMA at $0.24.


Information on these pages contains forward-looking statements that involve risks and uncertainties. Markets and instruments profiled on this page are for informational purposes only and should not in any way come across as a recommendation to buy or sell in these assets. You should do your own thorough research before making any investment decisions. FXStreet does not in any way guarantee that this information is free from mistakes, errors, or material misstatements. It also does not guarantee that this information is of a timely nature. Investing in Open Markets involves a great deal of risk, including the loss of all or a portion of your investment, as well as emotional distress. All risks, losses and costs associated with investing, including total loss of principal, are your responsibility. The views and opinions expressed in this article are those of the authors and do not necessarily reflect the official policy or position of FXStreet nor its advertisers. The author will not be held responsible for information that is found at the end of links posted on this page.

If not otherwise explicitly mentioned in the body of the article, at the time of writing, the author has no position in any stock mentioned in this article and no business relationship with any company mentioned. The author has not received compensation for writing this article, other than from FXStreet.

FXStreet and the author do not provide personalized recommendations. The author makes no representations as to the accuracy, completeness, or suitability of this information. FXStreet and the author will not be liable for any errors, omissions or any losses, injuries or damages arising from this information and its display or use. Errors and omissions excepted.

The author and FXStreet are not registered investment advisors and nothing in this article is intended to be investment advice.

Join Telegram

Recommended content


Recommended Content

Editors’ Picks

Celebrity meme coins controversy continues amid Pump.fun revenue dominance

Celebrity meme coins controversy continues amid Pump.fun revenue dominance

Pump.fun outperformed the Ethereum blockchain on Tuesday after raking in $1.99 million. Following this achievement, a meme coin based on actress Sydney Sweeney was the subject of controversy after its developers dumped their bags on investors.

More Meme Coins News

PEPE's on-chain metrics indicate potential rally after weeks of silence

PEPE's on-chain metrics indicate potential rally after weeks of silence

PEPE has struggled to see any significant price move after reaching an all-time high in May. Increased adoption rate and low MVRV ratio indicate a bullish run may be on the horizon. A single PEPE outflow from Binance worth $14.7 million gives credence to signs of bullish expectation.

More Pepe News

Ethereum has failed to overcome key resistance despite bullish sentiment surrounding ETH ETF

Ethereum has failed to overcome key resistance despite bullish sentiment surrounding ETH ETF

Ethereum (ETH) is down more than 1.4% on Tuesday following another ETH sale from the Ethereum Foundation. Meanwhile, crypto exchange Gemini's recent report reveals that ETH ETF could see about $5 billion in net inflows within six months of launch.

More Ethereum News

Crypto community blasts Polkadot following report of treasury spending

Crypto community blasts Polkadot following report of treasury spending

Polkadot reports $87 million of treasury spending during H1. Crypto community members expressed harsh feelings toward the DOT team's high spending. DOT is up more than 2% in the past 24 hours but risks correction following the report.

More Polkadot News

Bitcoin: BTC price correction could end in July, according to seasonal data

Bitcoin: BTC price correction could end in July, according to seasonal data

Bitcoin (BTC) price appears poised for a decline this week, influenced by slight outflows in US spot ETFs, selling activity among BTC miners, and a combined transfer of 4,690.28 BTC to centralized exchanges by the US and German governments.

Read full analysis

BTC

ETH

XRP