Dogecoin Price Analysis: DOGE trapped between massive barriers
- Dogecoin price is enclosed by various support and resistance levels, restricting a definitive outlook for the meme token.
- A DOGE release from the symmetrical triangle may yield a price reaction of 50%, up or down.
- A decisive daily close above the descending channel’s upper trend line confirms a bullish outlook.

Dogecoin price has been oscillating along the 50-day simple moving average (SMA) since May 20, complicating a bullish outlook for the digital asset. During the wide-ranging price, action DOGE has constructed a symmetrical triangle on the four-hour chart. The resolution of the pattern will dictate the next phase for Dogecoin price.
Dogecoin price performance in 2021 is a manifestation of crazy monetary policy
Dogecoin price declined about 75% from the May 8 high at $0.760 to the May 19 low at $0.195, putting it on the higher side of the range for declines in the cryptocurrency complex. However, the digital token did achieve a 70% rally off the May 19 low, closing DOGE back above the 50-day SMA, a level that has been involved in the price action of the last eight days.
The significant DOGE decline and ensuing consolidation released the overbought condition on the weekly Relative Strength Index (RSI) and nudged the daily RSI to the lowest reading since October 2020. Moreover, the daily volume on down days has not surpassed the 50-day SMA since May 10. In fact, excluding the May 19 crash, volume on down days has been around 25% of the 50-day average, reflecting no rush for the exits by investors or excitement to bid Dogecoin price higher.
Since May 24, Dogecoin price has been resting in a tight range supported by the May 12 low at $0.338 and restricted by a combination of the 50 four-hour moving average, the descending channel’s upper trend line and the minor symmetrical triangle’s upper trend line. The combination converges around $0.349.
On the upside, the measured move target for Dogecoin price is $0.535, and on the downside, it is $0.139. A resolution of the pattern to the upside will require a heavy volume thrust that may not be possible until DOGE resets with a decline down to the triangle’s lower trend line at $0.287.
Following the reset, Dogecoin price may be primed to reach the measured move target. First, DOGE will need to overcome the sizeable resistance at $0.349, the 200 four-hour SMA at $0.424 and then the 50% retracement of the May correction at $0.473.
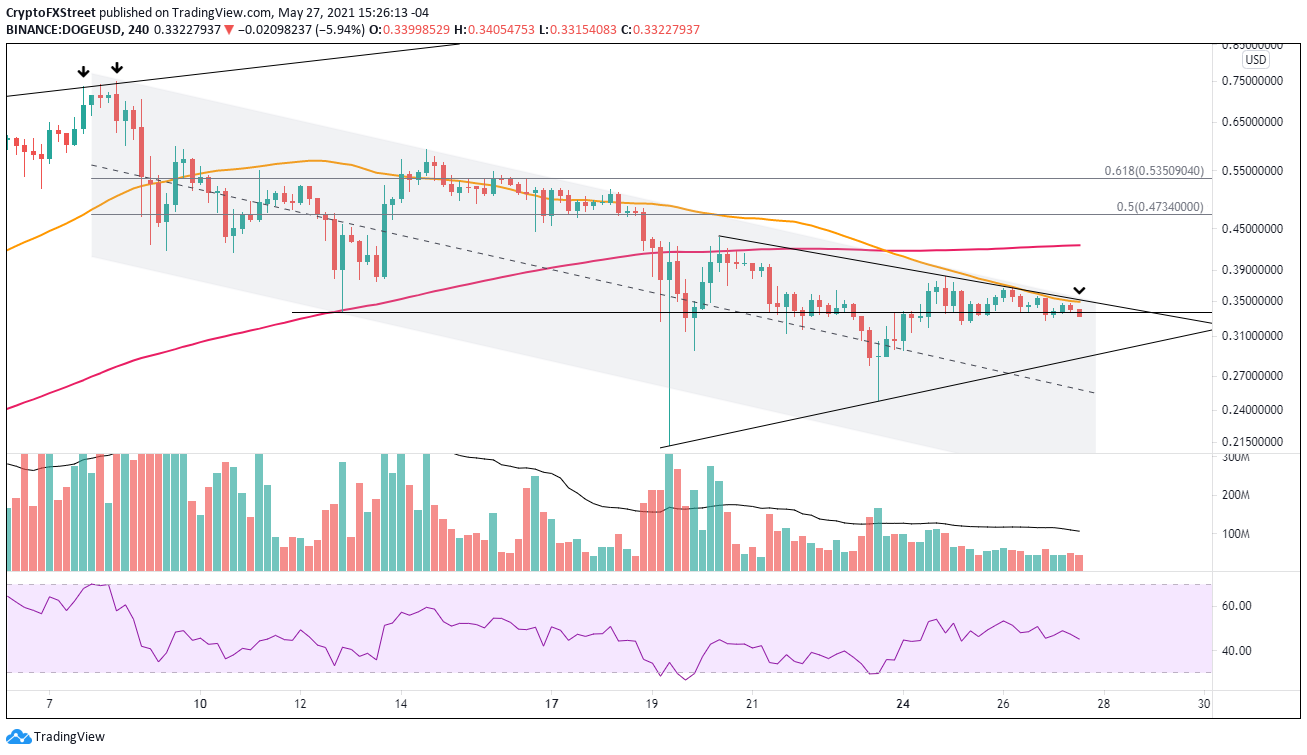
DOGE/USD 4-hour chart
An equally possible outcome for DOGE is that the reset down to the triangle’s lower trend line will not hold, exposing Dogecoin price to a decline to the descending channel’s lower trend line at $0.187 and possibly to the downside measured move target of $0.139.
MaybeIf Stanley Druckenmiller is correct, and the DOGE story is a “manifestation of the craziest monetary policy in history.” Or maybe, it results from a social media story orchestrated by Elon Musk and Mark Cuban. Whatever the reason or reasons, the current Dogecoin price chart is an enigma wrapped in a riddle.
Author

Sheldon McIntyre, CMT
Independent Analyst
Sheldon has 24 years of investment experience holding various positions in companies based in the United States and Chile. His core competencies include BRIC and G-10 equity markets, swing and position trading and technical analysis.


