- Dogecoin price responds to the oversold market with indecision and uncertainty, not characteristics of a significant low.
- DOGE fails at the 50-day simple moving average (SMA) with a sizeable reversal but confirms the double bottom.
- The 200-day SMA is the new line of defense as the digital token moves in an ascending parallel channel.
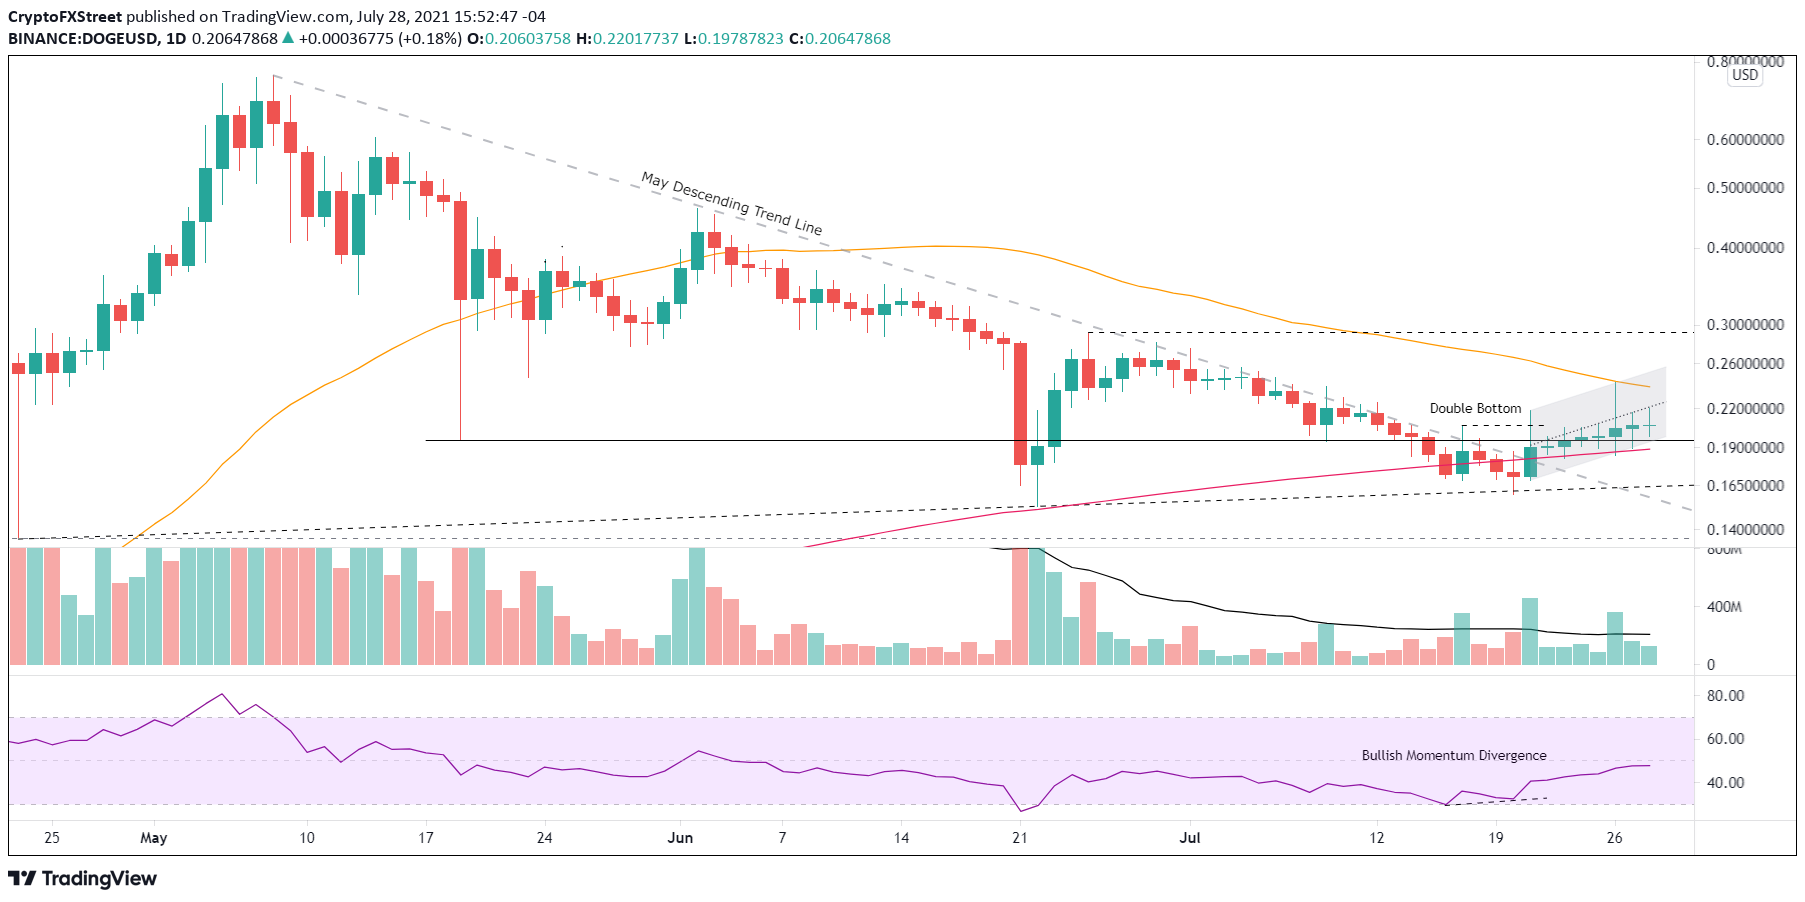
Dogecoin price rebound remains unvalidated as the cryptocurrency fails to register one close above the midline of an ascending parallel channel since the July 21 breakout. Without greater conviction, DOGE is not positioned for notably higher prices, and maybe the eight-day rebound is just a resting place before the correction resumes.
Dogecoin price behaves like a memecoin, not money
Over the last seven trading days, Dogecoin price has closed with four doji candlesticks, including today’s candlestick. The other three came very close. The lack of price traction embodied by the doji candlesticks is a clear reflection of indecision and uncertainty among the DOGE investor ranks. It may suggest the last eight days are simply a pause in the larger correction beginning in May.
A second concerning development is the inability of Dogecoin price to manufacture one daily close above the midline of the new ascending parallel channel. Once again, emphasizing the underlying reluctance that is accompanying any intra-day strength for DOGE.
If investors did not target the breakout on July 21 as an entry price, it is challenging now to isolate a timely entry price as the rapidly descending 50-day SMA at $0.238 presses down on price. To adjust for the lack of conviction, DOGE investors should wait for a daily Dogecoin price close above the 50-day SMA before allocating capital.
DOGE/USD daily chart
Interestingly, Dogecoin price is granted three support levels that could contain weakness moving forward, and they closely align. The May 19 low of $0.195 has been instructive for DOGE recently, on the up and downside. A second layer of support is the lower line of the ascending parallel channel at $0.193. The final level is the strategically important 200-day SMA at $0.189
A failure to hold the 200-day SMA on a daily closing basis introduces the potential to break below the July 20 low of $0.159 and the June 22 low of $0.152
The presence of numerous doji candlestick patterns on the daily chart is not impressive, but it does not guarantee that the digital asset will flip to the downside. Nevertheless, it confirms a balance between supply and demand that is consistent with indecision and uncertainty.
In general, an uncertain investor base tends to rush for the exits at any sign of trouble. As a result, a Dogecoin price close below the 200-day SMA will invite a new wave of selling pressure, not the kind that is characteristic of real money.
Here, FXStreet's analysts evaluate where DOGE could be heading next as it looks ready to jump.
Note: All information on this page is subject to change. The use of this website constitutes acceptance of our user agreement. Please read our privacy policy and legal disclaimer. Opinions expressed at FXstreet.com are those of the individual authors and do not necessarily represent the opinion of FXstreet.com or its management. Risk Disclosure: Trading foreign exchange on margin carries a high level of risk, and may not be suitable for all investors. The high degree of leverage can work against you as well as for you. Before deciding to invest in foreign exchange you should carefully consider your investment objectives, level of experience, and risk appetite. The possibility exists that you could sustain a loss of some or all of your initial investment and therefore you should not invest money that you cannot afford to lose. You should be aware of all the risks associated with foreign exchange trading, and seek advice from an independent financial advisor if you have any doubts.
Recommended Content
Editors’ Picks

Is Altcoin Season here as Bitcoin reaches a new all-time high?
Bitcoin reaches a new all-time high of $98,384 on Thursday, with altcoins following the suit. Reports highlight that the recent surge in altcoins was fueled by the victory of crypto-friendly candidate Donal Trump in the US presidential election.

Shanghai court confirms legal recognition of crypto ownership
A Shanghai court has confirmed that owning digital assets, including Bitcoin, is legal under Chinese law. Judge Sun Jie of the Shanghai Songjiang People’s Court shared this opinion through the WeChat account of the Shanghai High People’s Court.

BTC hits an all-time high above $97,850, inches away from the $100K mark
Bitcoin hit a new all-time high of $97,852 on Thursday, and the technical outlook suggests a possible continuation of the rally to $100,000. BTC futures have surged past the $100,000 price mark on Deribit, and Lookonchain data shows whales are accumulating.

Shiba Inu holders withdraw 1.67 trillion SHIB tokens from exchange
Shiba Inu trades slightly higher, around $0.000024, on Thursday after declining more than 5% the previous week. SHIB’s on-chain metrics project a bullish outlook as holders accumulate recent dips, and dormant wallets are on the move, all pointing to a recovery in the cards.

Bitcoin: New high of $100K or correction to $78K?
Bitcoin surged to a new all-time high of $93,265 in the first half of the week, followed by a slight decline in the latter half. Reports highlight that Bitcoin’s current level is still not overvalued and could target levels above $100,000 in the coming weeks.

Best Forex Brokers with Low Spreads
VERIFIED Low spreads are crucial for reducing trading costs. Explore top Forex brokers offering competitive spreads and high leverage. Compare options for EUR/USD, GBP/USD, USD/JPY, and Gold.
