Dogecoin presents buying opportunity before DOGE returns to $0.28
- Dogecoin price action trades lower and hits the lower trendline of a falling wedge pattern.
- Significant evidence suggests that a major bear trap and short squeeze will likely commence soon.
- Point and Figure chart supports Japanese Candlestick analysis in identifying a probable bottom.

Dogecoin price action has certainly been on the downswing of late. Fears that a capitulation move is about to begin are well-founded, but follow-through by bears has yet to occur.
Dogecoin price develops powerful bullish reversal patterns on its candlestick chart and Point and Figure chart
Dogecoin price is overwhelmingly bearish on its daily Ichimoku chart. However, that trend will likely find a violent reversal or a robust corrective move very soon. The primary reason for this reversal, on the candlestick chart, is the presence of a falling wedge pattern.
Out of all the standard geometric patterns in technical analysis (specifically Japanese candlesticks or American bar charts), wedge patterns have the highest positive expectancy ratio of turning into profitable trade setups. Wedge patterns define an overbought/oversold market and represent excess. A rising wedge is a bearish reversal pattern, and a falling wedge is a bullish reversal pattern.
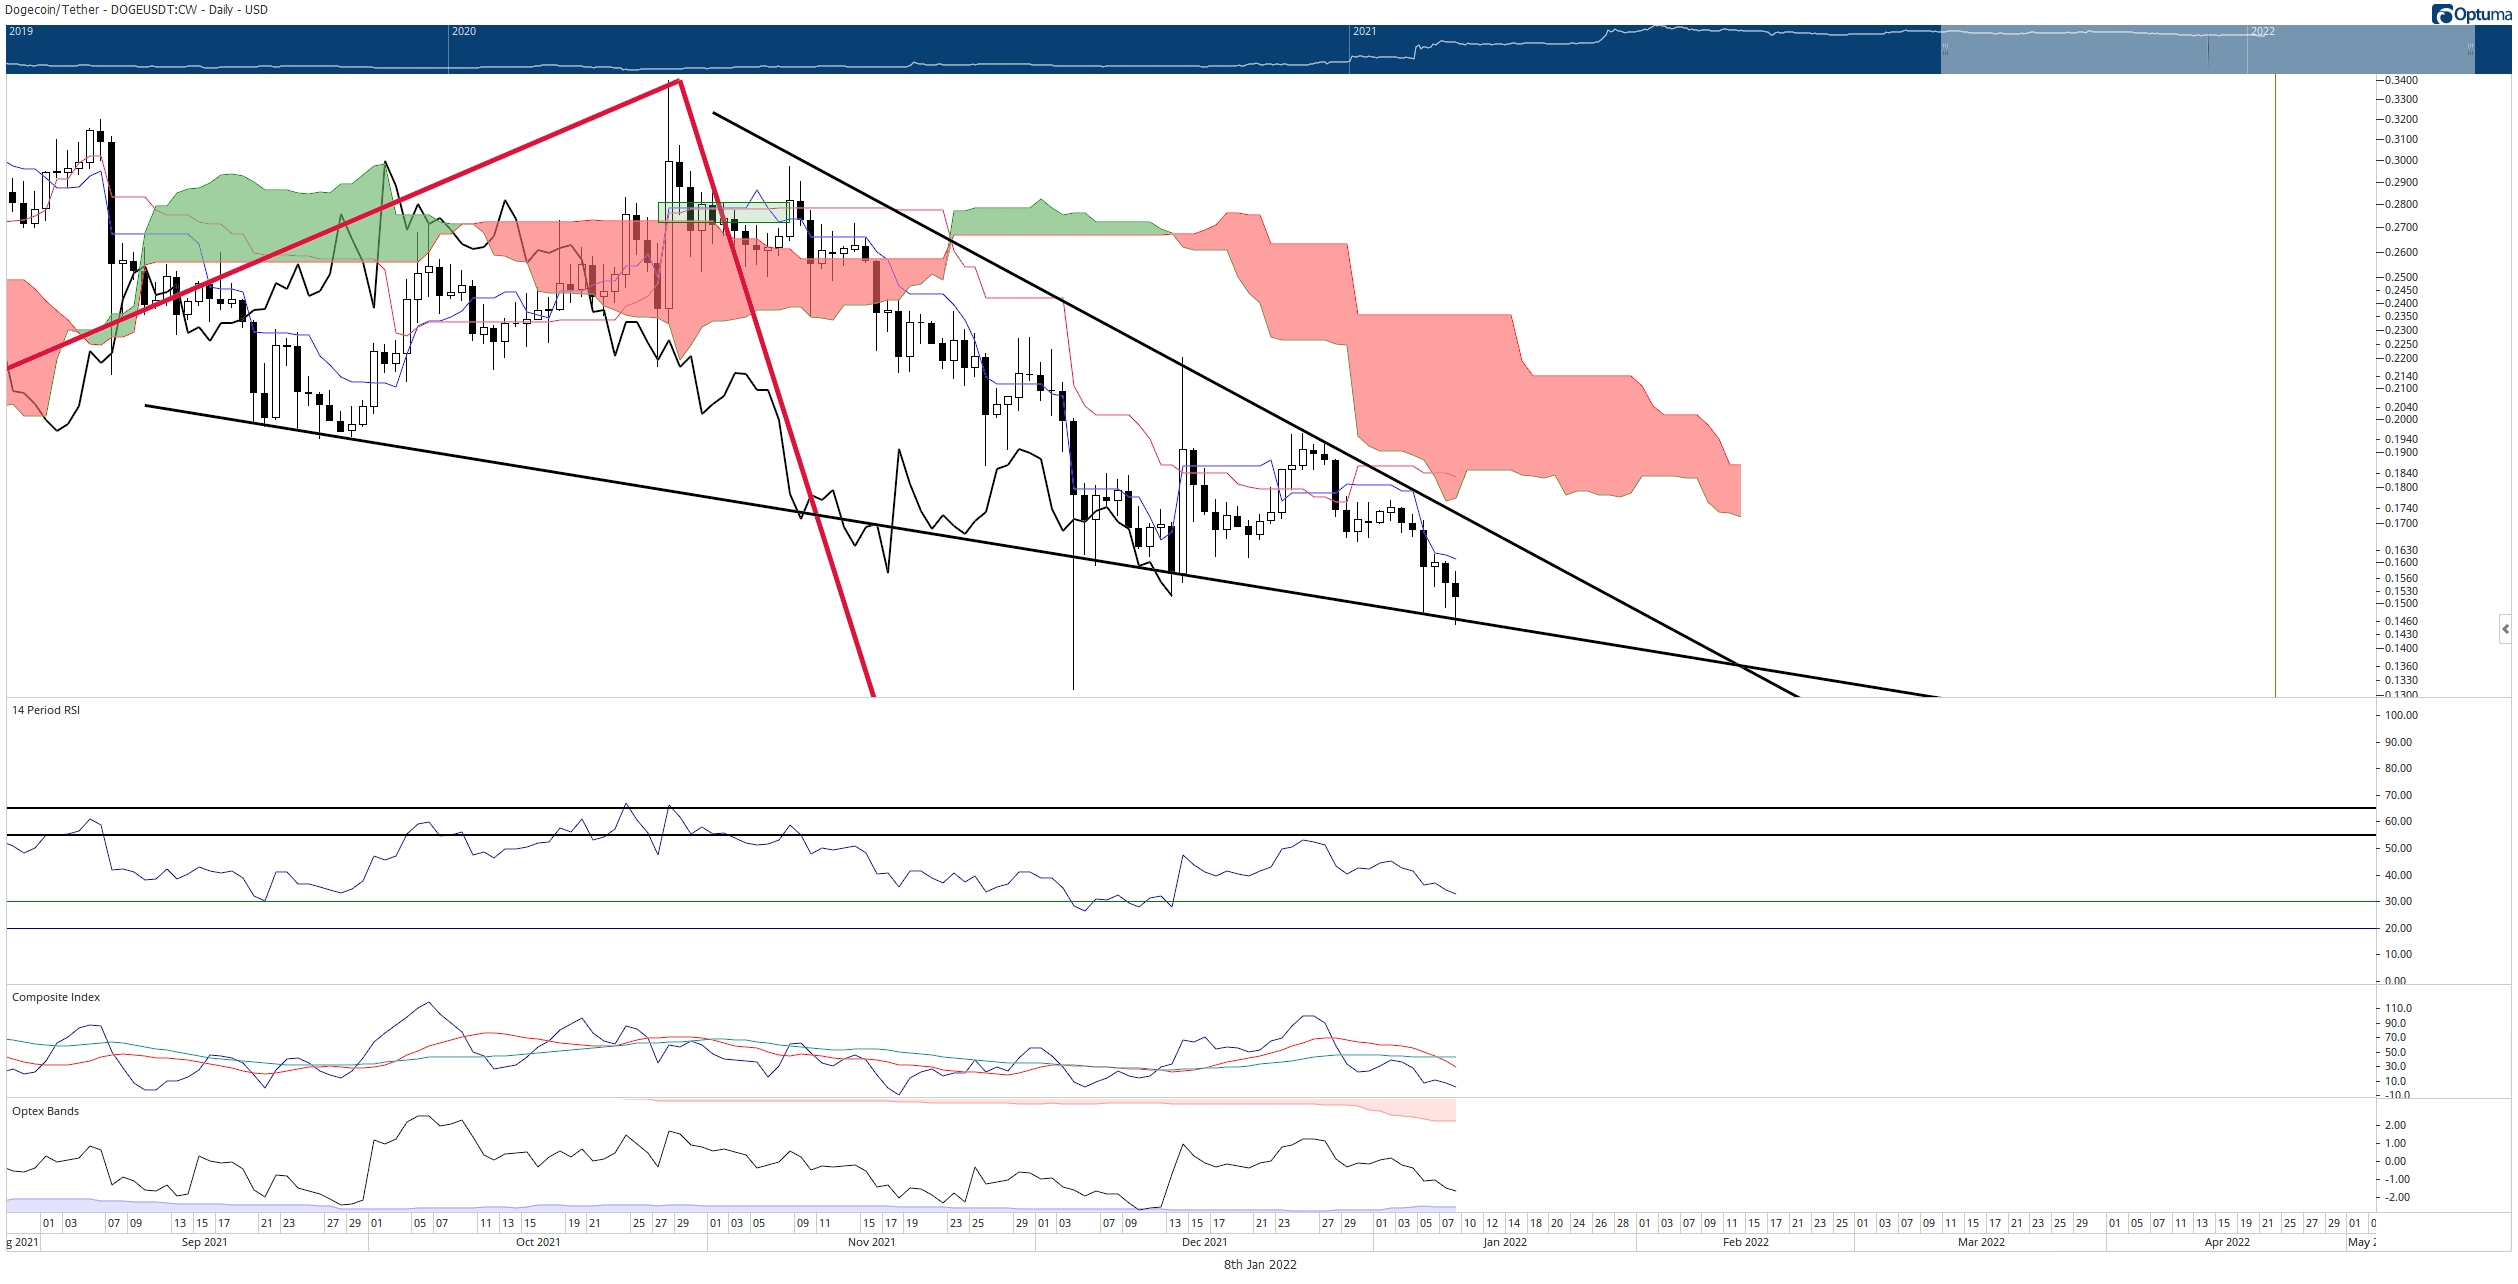
DOGE/USDT Daily Ichimoku Chart
Dogecoin is right up against the lower trendline of a falling wedge. DOGE is trading at these extremes while creating max mean levels between the daily close and the Kijun-Sen, warning of a mean reversion move higher.
On the $0.005/3-box reversal Point and Figure chart, Dogecoin has developed a Bullish Shakeout pattern. This pattern is only valid if an instrument is in a broader uptrend and at the bottom of a corrective move – both of which are true for Dogecoin price. The combination of the falling wedge and the Bullish Shakeout pattern present a theoretical low risk, high reward trade setup.
The theoretical long trade setup for Dogecoin price is a buy stop order at $0.17, a stop-loss order at $0.15, and a profit target at $0.28. This possible trade setup represents a 5.5:1 reward/risk setup with an implied profit target of nearly 69% from the entry. In addition, a trailing stop of two to three boxes would help protect any profit made post entry.
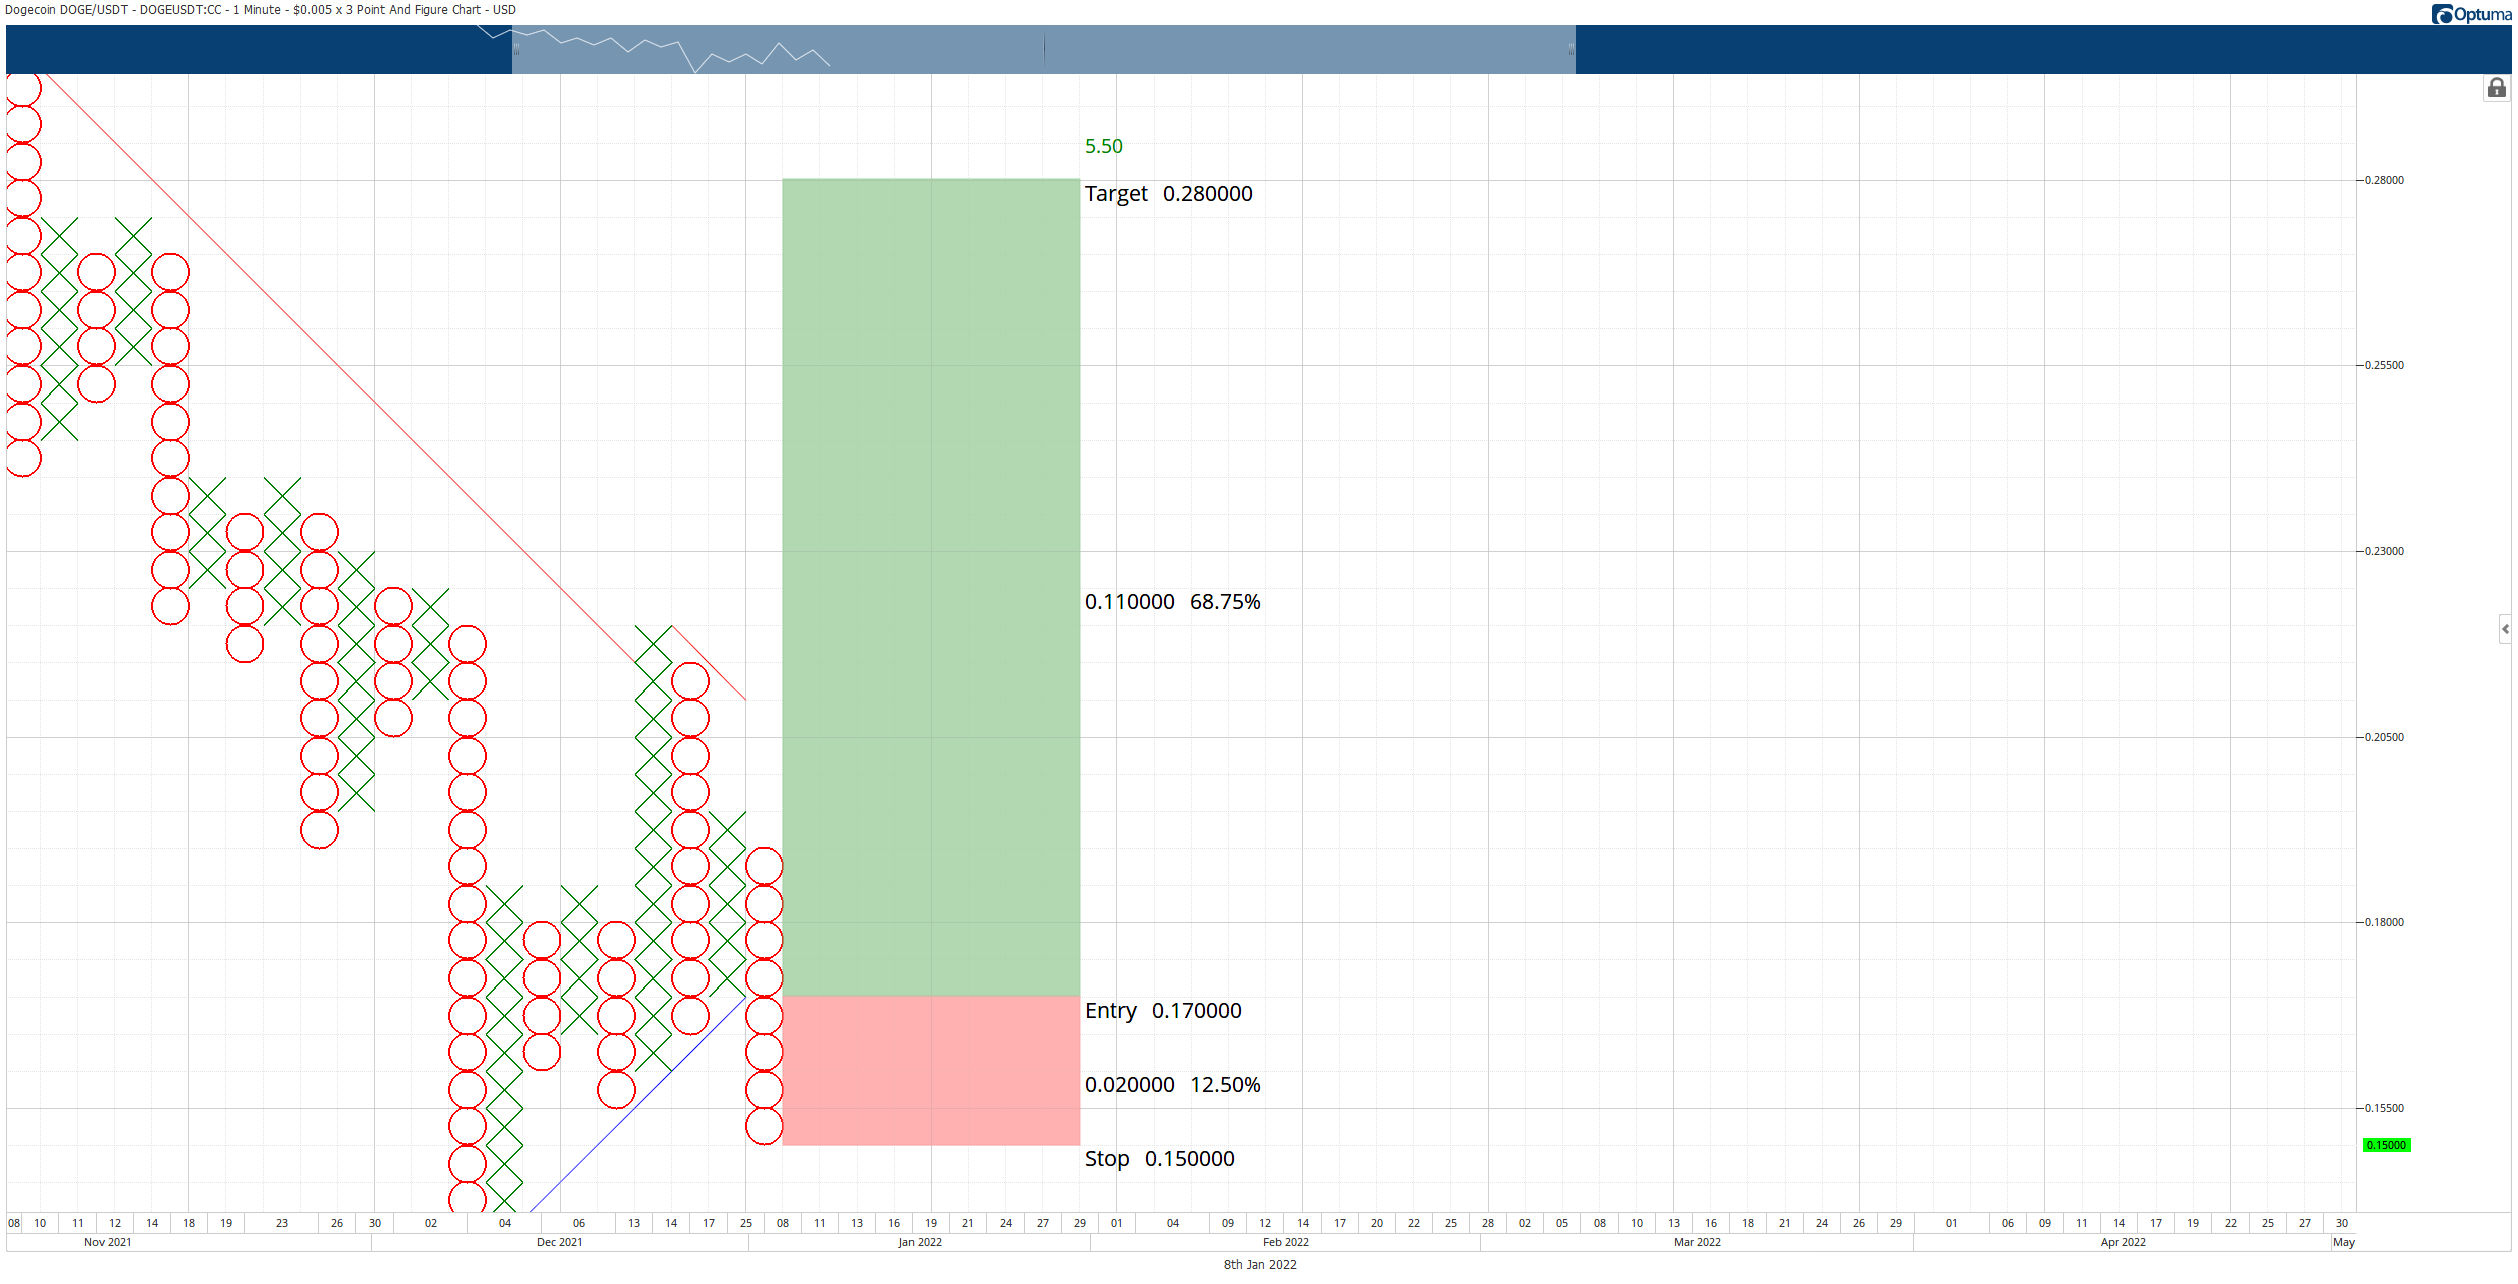
$0.005/3-box Reversal Point and Figure Chart
Traders will want to watch for any sustained move below the falling wedge lower trendline that would result in at least three days of closes below the lower trendline. That would invalidate this analysis's theoretical long setup and bullish outlook.
Author

Jonathan Morgan
Independent Analyst
Jonathan has been working as an Independent future, forex, and cryptocurrency trader and analyst for 8 years. He also has been writing for the past 5 years.


