Dogecoin Elliott Wave technical analysis [Video]
![Dogecoin Elliott Wave technical analysis [Video]](https://editorial.fxstreet.com/images/Markets/Currencies/Cryptocurrencies/Dogecoin/dogecoin-200x200-637483778649728159_XtraLarge.jpg)
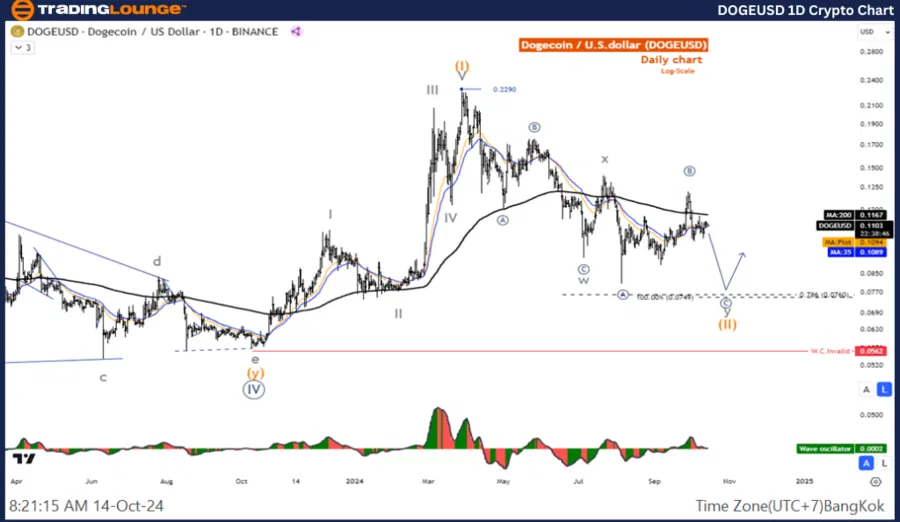
Dogecoin Elliott Wave analysis daily chart
Function: Counter trend.
Mode: Corrective.
Structure: Double Corrective.
Position: Wave Y.
Direction Next higher Degrees: Wave (II) of Impulse.
Details: Wave (II) may not be complete, price is likely to be below 0.076.
Dogecoin/ U.S. dollar (DOGEUSD) Trading Strategy: This is a 5 wave retracement of wave (C), where we are in the final stages of wave Y, which is likely to test the 0.076 level, so the overall picture is a short term retracement before another rally.
Dogecoin/ U.S. dollar (DOGEUSD) Technical Indicators: The price is below the MA200 indicating a Downtrend, The Wave Oscillator is a Bearish Momentum.
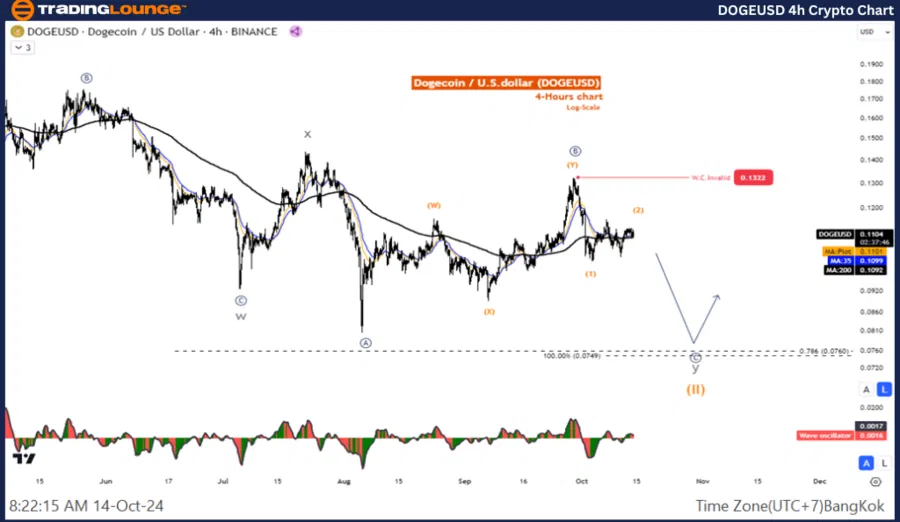
DOGE/USD four-hour chart
Function: Counter trend
Mode: Corrective
Structure: Double Corrective
Position: Wave Y
Direction Next higher Degrees: wave (II) of Impulse
Details: Wave (II) may not be complete, price is likely to be below 0.076
Dogecoin/ US dollar (DOGEUSD) Trading Strategy: This is a 5 wave retracement of wave (C), where we are in the final stages of wave Y, which is likely to test the 0.076 level, so the overall picture is a short term retracement before another rally.
Dogecoin/ US dollar (DOGEUSD) Technical Indicators: The price is below the MA200 indicating a Downtrend, The Wave Oscillator is a Bearish Momentum.
Dogecoin Elliott Wave technical analysis [Video]
Author

Peter Mathers
TradingLounge
Peter Mathers started actively trading in 1982. He began his career at Hoei and Shoin, a Japanese futures trading company.


