|

Dogecoin (DOGE/USD) Elliott Wave technical analysis

Dogecoin (DOGE/USD)

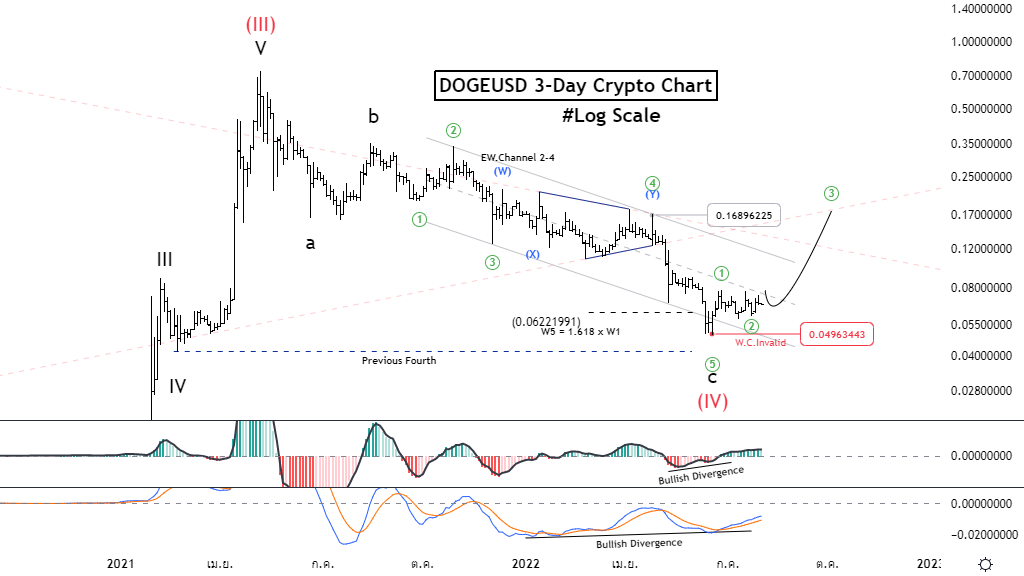
Elliott Wave Analysis TradingLounge Daily Chart, 2 August 2022,

DOGE/USD Elliott Wave technical analysis

Mode: Motive

Structure: Impulse

Position: Wave 5

Direction Next higher Degrees: wave C of Zigzag

Details: Wave 5 may have finished, and prices are rising.

Wave Cancel invalid Level: 0.04963

Dogecoin Trading Strategy: As the forecast wave (IV) is over, we are looking for opportunities to join the uptrend by looking for throwbacks in wave II and IV sub-wave of (V). But the price must not reverse past 0.04963, which is the beginning of wave 1.

Dogecoin Technical Indicators: Bullish Divergent signal on both MACD and MACD Histogram

TradingLounge analyst: Kittiampon Somboonsod

Chart

Dogecoin (DOGE/USD)

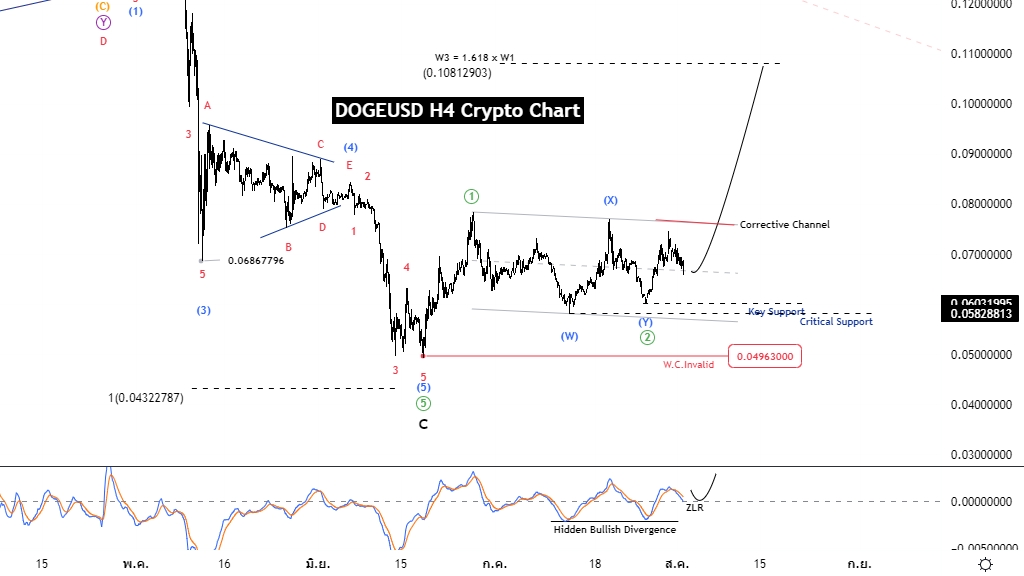
Elliott Wave Analysis TradingLounge 4H Chart, 2 August 2022.

Mode: Motive.

Structure: Impulse

Position: Wave 2

Direction Next higher Degrees:

Details:  may be rising again in Wave 3.

Wave Cancel invalid Level: 0.04963.

Dogecoin Trading Strategy:  The price structure has begun to form an uptrend, with wave ((1)) over and wave ((2)) moving sideways with a double corrective pattern. May have to wait for the Break Corrective Channel to be confirmed. but price must not reverse past 0.04963, which is the beginning of wave 1.

Dogecoin Technical Indicators: Hidden Bullish Divergent signal, wait for a reversal at the 0 line of the MACD to confirm.

Chart

Author

Peter Mathers

Peter Mathers

TradingLounge

Peter Mathers started actively trading in 1982. He began his career at Hoei and Shoin, a Japanese futures trading company.

More from Peter Mathers
Share:

Editor's Picks

Bitcoin, Ethereum and Ripple consolidate after massive sell-off

Bitcoin, Ethereum, and Ripple prices consolidated on Monday after correcting by nearly 9%, 8%, and 10% in the previous week, respectively. BTC is hovering around $70,000, while ETH and XRP are facing rejection at key levels. Traders should be cautious: despite recent stabilization, upside recovery for these top three cryptocurrencies is capped as the broader trend remains bearish.

Ethereum: Trend Research capitulates, BitMine's Thomas Lee sees a V-shaped recovery

Ethereum had one of its sharpest historic declines over the past 10 days, shedding 40% of its value and briefly sliding below $2,000. The dip also saw ETH move below its realized price, or the average cost basis of investors — an occurrence that has historically accelerated selling pressure as investors cut losses.

Why Bitcoin and top cryptos are falling: Bitwise

The crypto market crash since October isn't down to a single factor but a combination of several, according to Bitwise CIO Matt Hougan. In a note to investors on Friday, Hougan outlined six key factors that potentially contributed to the crash that pushed down nearly every top crypto by more than 50% from prices seen over four months ago.

XRP recovery gains momentum despite retail market decline

Ripple is accelerating its recovery, trading above $1.36 at the time of writing on Friday, as investors adjust their positions following a turbulent week in the broader crypto market. The remittance token is up over 21% from its intraday low of $1.12.

Bitcoin Price Annual Forecast: BTC holds long-term bullish structure heading into 2026

Bitcoin (BTC) is wrapping up 2025 as one of its most eventful years, defined by unprecedented institutional participation, major regulatory developments, and extreme price volatility.

Bitcoin: The worst may be behind us

Bitcoin (BTC) price recovers slightly, trading at $65,000 at the time of writing on Friday, after reaching a low of $60,000 during the early Asian trading session. The Crypto King remained under pressure so far this week, posting three consecutive weeks of losses exceeding 30%.