- Goldman Sachs believes the stock market will drop 9% in the next three months.
- Since Bitcoin tightly correlates with the S&P 500, it is highly likely to follow the same path.
- Strategists at the investment bank are looking at two outcomes depending on Fed’s pivot - a soft landing and a hard landing.
In a note to investors, Goldman Sachs, a multinational investment bank, revealed a gloomy outlook for stock markets in 2023. The analysts believe that a short-term drop in the S&P 500 is likely.
Bitcoin, however, has been highly correlated with the stock market and developments in that ecosystem since March 2020. As a result, investors should expect a similar outlook for the big crypto. There is, however, a wild card scenario that could prematurely kick-start a rally for BTC.
Bitcoin and Stock markets
Bitcoin price highly correlates to the S&P 500 after COVID struck the world in March 2020. Since then, the 90-day correlation between the assets continued to increase and hit an all-time high of 0.63 on September 22, 2022. Although this number has declined since then, the connection between cryptos and stocks is relatively high.
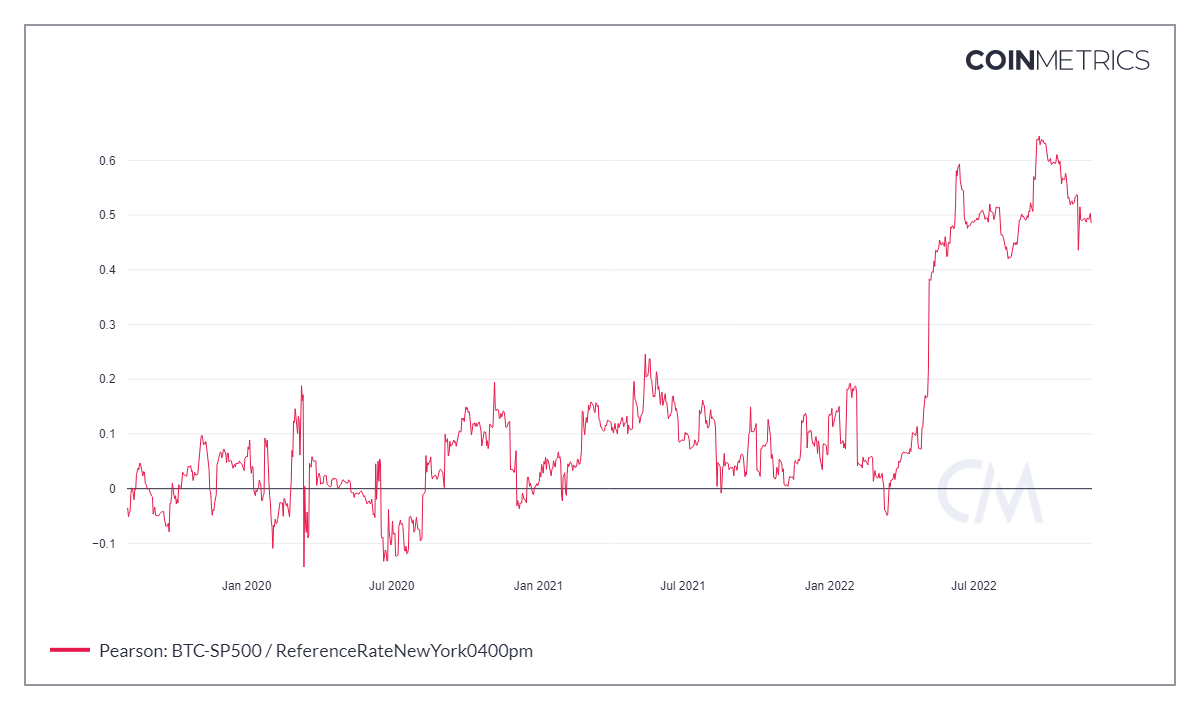
BTC vs. S&P 500 correlation
Goldman Sachs targets S&P 500 to hover around 4000 for the next year, roughly where the index is currently trading. This forecast changes based on how the Federal Reserve will control inflation.
If the Feds manage a soft landing, Goldman Sachs strategists believe 3,600 to be the bottom. On the contrary, a hard landing could push the S&P 500 down to 3,150, a 21% crash from the current position.
Bitcoin price and its bullish outlook
If the stock market crashes down to 3,600, there is a chance that the Bitcoin price will not follow the S&P 500. The reason for this is simple, the big crypto has already been through three massive crashes since its all-time high in November 2021 and has shed roughly 77%.
However, if the index crashes 21%, crypto enthusiasts should entertain the idea of Bitcoin price revisiting the support area, extending from $13,575 to $11,898.
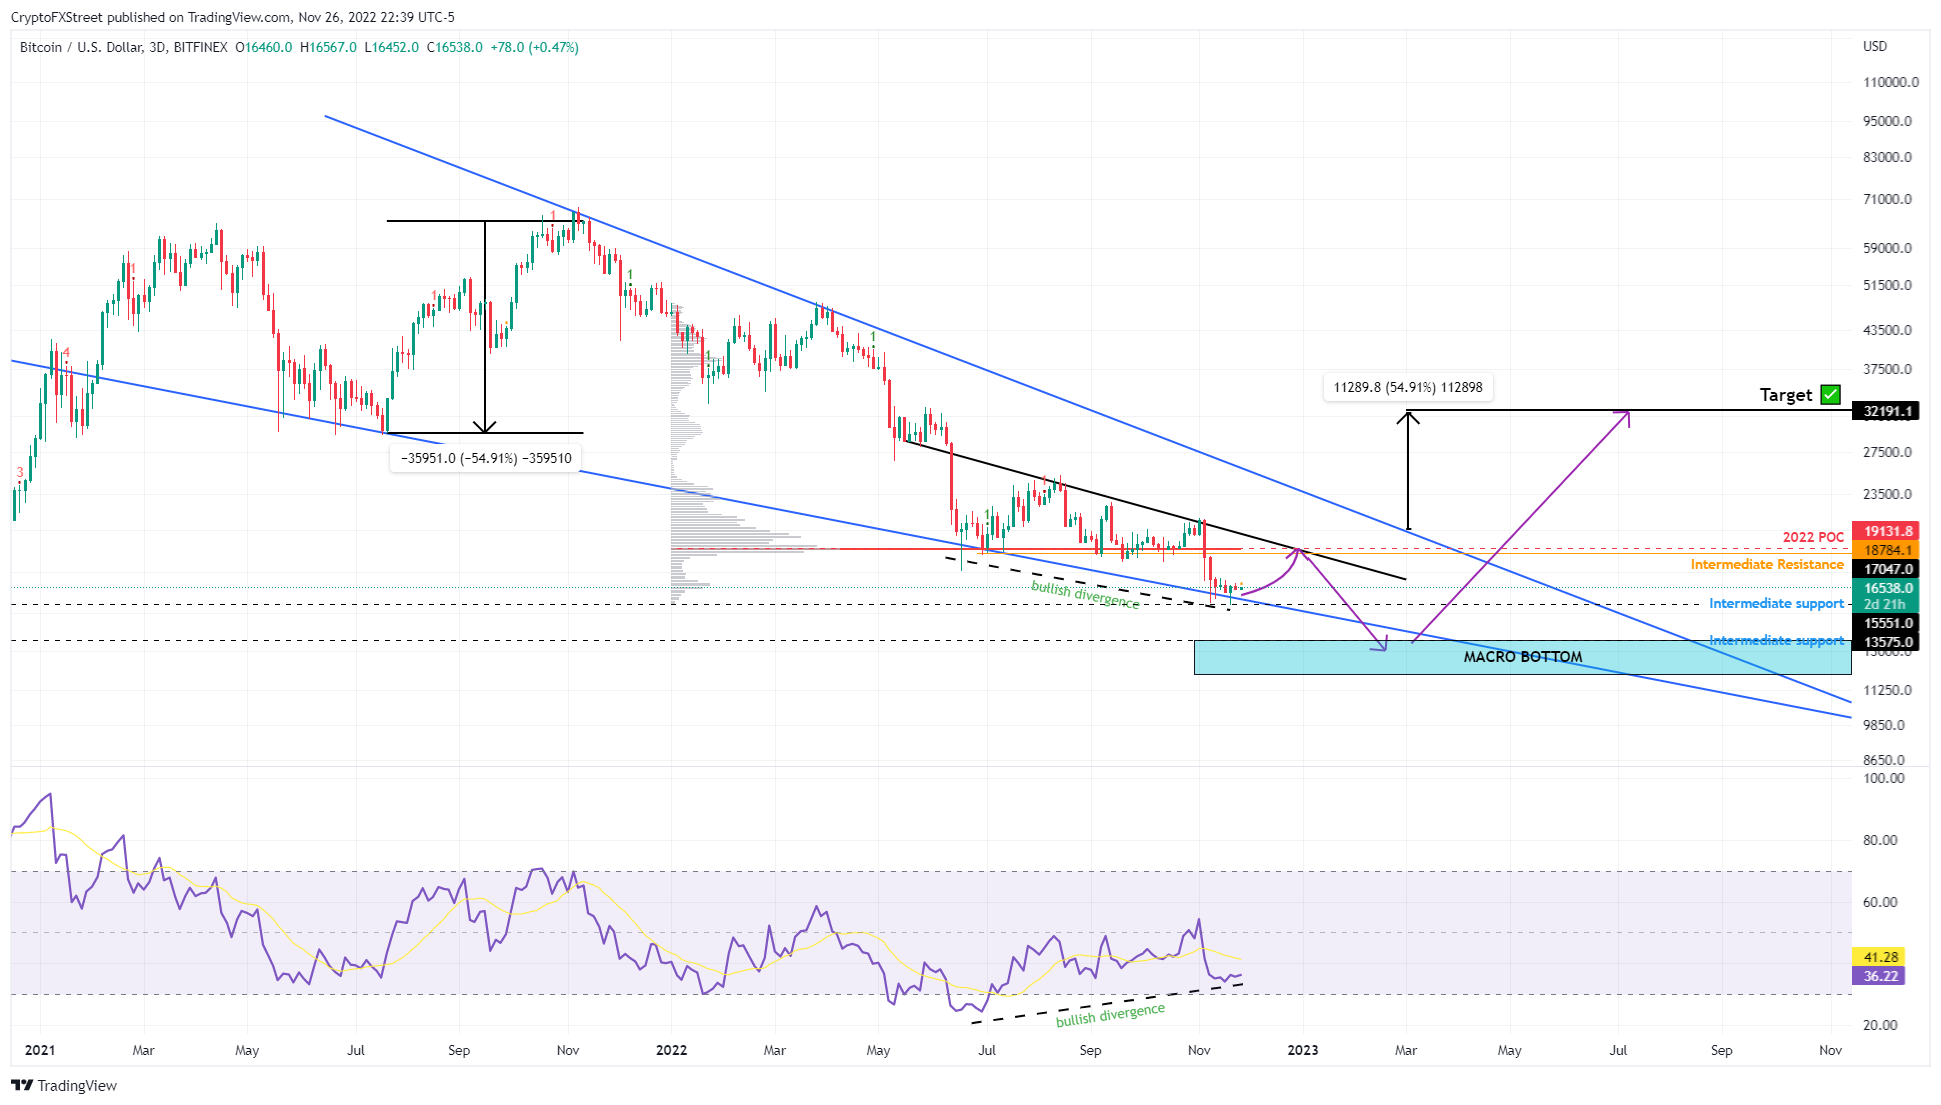
BTC/USDT 3-day chart
While the bearish narratives are not set in stone, investors should consider the possibility that Bitcoin and S&P 500 correlation breaks, allowing BTC to behave like gold, a safe-haven asset. In such a case, things could change drastically, allowing Bitcoin price, which is currently trading at $16,547, to trigger a run-up.
Technicals show that the big crypto is hovering at the lower trend line of a 500-day-old falling wedge. Adding more to this optimistic outlook is the bullish divergence that has been developing for the last five months.
If not a 54% breakout move to $32,191 forecasted by the falling wedge, investors can expect an 18% upswing to $19,011 or a retest of the $20,000 psychological level.
Information on these pages contains forward-looking statements that involve risks and uncertainties. Markets and instruments profiled on this page are for informational purposes only and should not in any way come across as a recommendation to buy or sell in these assets. You should do your own thorough research before making any investment decisions. FXStreet does not in any way guarantee that this information is free from mistakes, errors, or material misstatements. It also does not guarantee that this information is of a timely nature. Investing in Open Markets involves a great deal of risk, including the loss of all or a portion of your investment, as well as emotional distress. All risks, losses and costs associated with investing, including total loss of principal, are your responsibility. The views and opinions expressed in this article are those of the authors and do not necessarily reflect the official policy or position of FXStreet nor its advertisers. The author will not be held responsible for information that is found at the end of links posted on this page.
If not otherwise explicitly mentioned in the body of the article, at the time of writing, the author has no position in any stock mentioned in this article and no business relationship with any company mentioned. The author has not received compensation for writing this article, other than from FXStreet.
FXStreet and the author do not provide personalized recommendations. The author makes no representations as to the accuracy, completeness, or suitability of this information. FXStreet and the author will not be liable for any errors, omissions or any losses, injuries or damages arising from this information and its display or use. Errors and omissions excepted.
The author and FXStreet are not registered investment advisors and nothing in this article is intended to be investment advice.
Recommended Content
Editors’ Picks

Bitcoin Weekly Forecast: BTC nosedives below $95,000 as spot ETFs record highest daily outflow since launch
Bitcoin price continues to edge down, trading below $95,000 on Friday after declining more than 9% this week. Bitcoin US spot ETFs recorded the highest single-day outflow on Thursday since their launch in January.

Bitcoin crashes to $96,000, altcoins bleed: Top trades for sidelined buyers
Bitcoin (BTC) slipped under the $100,000 milestone and touched the $96,000 level briefly on Friday, a sharp decline that has also hit hard prices of other altcoins and particularly meme coins.

Solana Price Forecast: SOL’s technical outlook and on-chain metrics hint at a double-digit correction
Solana (SOL) price trades in red below $194 on Friday after declining more than 13% this week. The recent downturn has led to $38 million in total liquidations, with over $33 million coming from long positions.

SEC approves Hashdex and Franklin Templeton's combined Bitcoin and Ethereum crypto index ETFs
The SEC approved Hashdex's proposal for a crypto index ETF. The ETF currently features Bitcoin and Ethereum, with possible additions in the future. The agency also approved Franklin Templeton's amendment to its Cboe BZX for a crypto index ETF.

Bitcoin: 2025 outlook brightens on expectations of US pro-crypto policy
Bitcoin (BTC) price has surged more than 140% in 2024, reaching the $100K milestone in early December. The rally was driven by the launch of Bitcoin Spot Exchange Traded Funds (ETFs) in January and the reduced supply following the fourth halving event in April.

Best Forex Brokers with Low Spreads
VERIFIED Low spreads are crucial for reducing trading costs. Explore top Forex brokers offering competitive spreads and high leverage. Compare options for EUR/USD, GBP/USD, USD/JPY, and Gold.