DeFi Top 3 Losers: Loopring, SushiSwap and Band Protocol
- The ratio of DeFi tokens’ market cap to ETH went from being around 25% in late August to just over 15%.
- The total market cap of the DeFi space currently stands at $5.35 billion.

The craze surrounding DeFi has relatively settled down since the September crash. IntoTheBlock noted on Twitter that the ratio of DeFi tokens’ market cap to Ethereum went from being around 25% in late August to just over 15%. As per Santiment, the total market cap of the DeFi space currently stands at $5.35 billion. We are going to put the three biggest losers in the DeFi space under the microscope – Loopring (LRC), SushiSwap (SUSHI) and Band Protocol (BAND).
Loopring goes for a dive
The total value locked up in LRC has dropped from $21.29 million on September 18 to $14.74 million. Looking into the price action, LRC faced rejection at the $0.26 resistance line and crashed down to $0.144, at the time of writing. In the process, the price fell below the 50-day and 100-day SMAs.
LRC/USDT daily chart
The MACD shows increasing bearish momentum, so a further downturn in price is expected. IntoTheBlock’s In/Out of the Money Around Price (IOMAP) shows two strong support walls at $0.134 and $0.125. The latter is strong enough to absorb a significant amount of sell pressure.
LRC IOMAP
Things don’t look good for SUSHI
The amount of value locked up in SUSHI has dropped from $1.42 billion on September 12 to $254 million at the time of writing. Looking at the price action, SUSHI has crashed from $8.90, September 2020 to $0.64 at the time of writing. That’s a 92.8% drop in valuation.
SUSHI/USDT daily chart
The price has two strong resistance barriers, $0.67 and $0.695, as defined by the IOMAP. However, there is a lack of healthy support zones on the downside, which doesn’t bode well for the bulls. As such, one can expect the price to fall below $0.62.
SUSHI IOMAP
Band Protocol in a downtrend
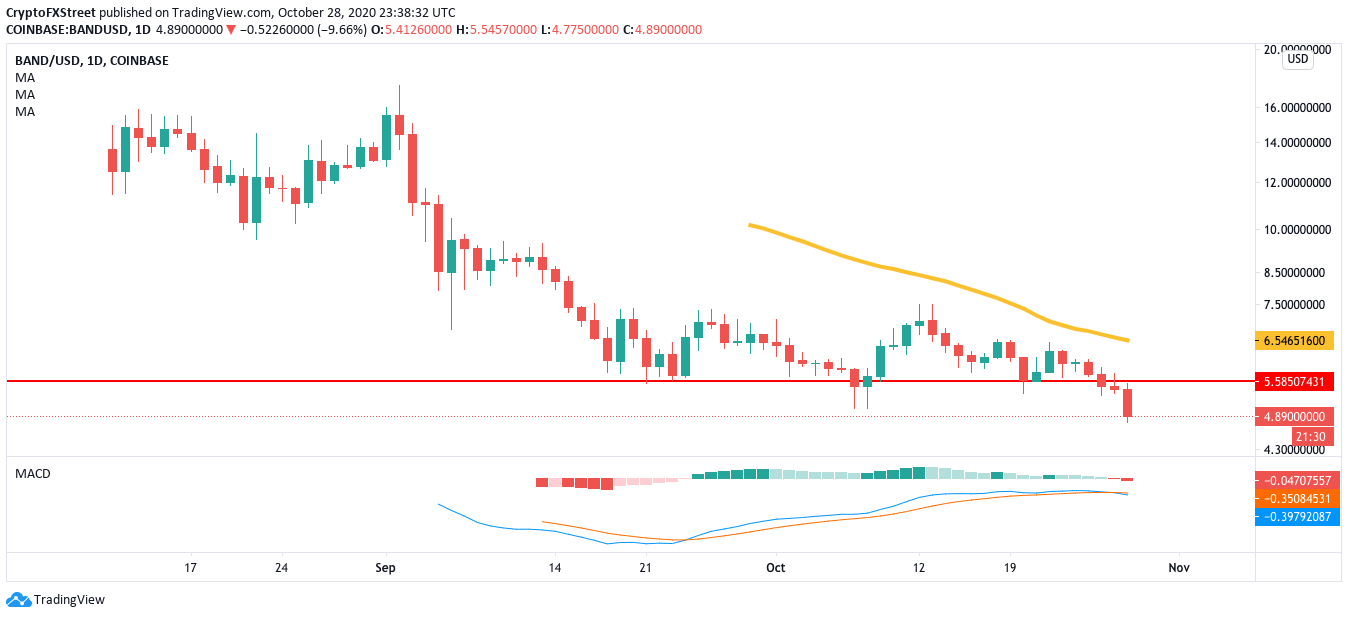
BAND was priced at $15.58 on September 2 and has since crashed by 68.50% to $4.89. The MACD shows increasing bearish momentum, so a further dip in price is expected. The most notable resistance, as defined by the IOMAP, is at $5.55.
BAND/USD daily chart
As per the IOMAP, previously at the $5.55 barrier, 182 addresses had purchased 372,000 BAND tokens. Looking at the downside, there is a lack of healthy support walls. As such, it won’t be a surprise to see the asset drop below $4.15.
BAND IOMAP
Key price levels to watch
For LRC, the bears will look to drop the price to $0.125. That’s the most notable zone for this asset.
SUSHI bulls will need to make sure that the price doesn’t fall below $0.62 to prevent a catastrophic drop.
Similarly, BAND buyers need to make sure that the asset doesn’t fall below $4.15. Quietly like SUSHI, BAND also doesn’t have any healthy support walls.
Author

Rajarshi Mitra
Independent Analyst
Rajarshi entered the blockchain space in 2016. He is a blockchain researcher who has worked for Blockgeeks and has done research work for several ICOs. He gets regularly invited to give talks on the blockchain technology and cryptocurrencies.


