DeFi protocols Uniswap and SushiSwap continue claiming new all-time highs as trading volume skyrockets
- Uniswap and SushiSwap DEX volume skyrocket alongside their massive price action.
- SushiSwap emerges as the biggest Uniswap competitor, disapproving critics.

UniSwap UNI) and SushiSwap (SUSHI) continue posting new record highs, ignoring the uncertainty brought into the market by Bitcoin (BTC). At the time of writing, UNI is exchanging hands at $9.42 following a minor retreat from price levels close to $10. On the other hand, SUSHI is trading at $8.4 barely a day after hitting a new all-time high at $8.
SushiSwap proves it is not an opportunistic copycat
Following the launch of the token, SUSHI in August 2020, many immediately branded it an opportunistic coin that aimed at taking liquidity from the established Uniswap protocol. SushiSwap was then engulfed in drama when its CEO left with a fair amount of the token's supply.
However, five months later, SUSHI has proved to the cryptocurrency community that it is a worthy Uniswap competitor. Besides hitting new high after new high, the token's decentralized exchange (DEX) has hit record highs in January.
Uniswap leads in DEX volume around $5.8 billion at the time of writing but is closely followed by SushiSwap at $3.2 billion. The growth in SushiSwap volume is massive despite Uniswap's lead, especially when its only 569 pairs are considered UNI's 28,428.
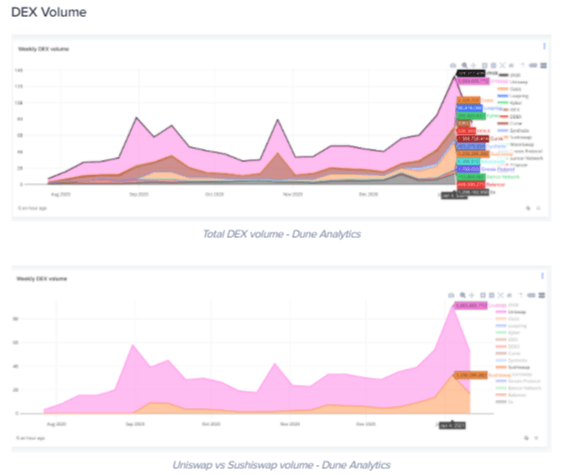
DEX volume chart
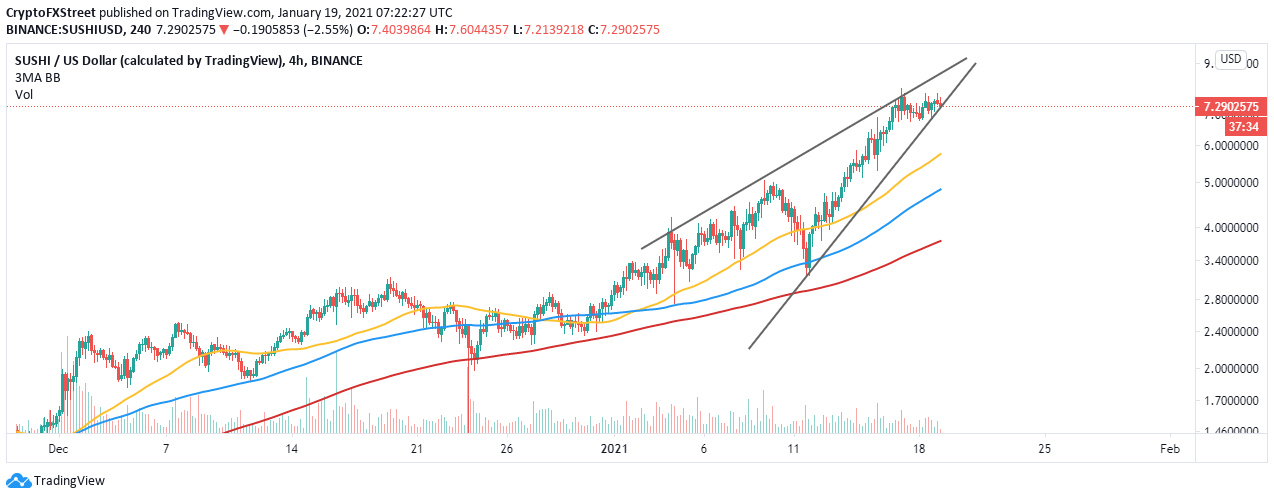
Meanwhile, the 4-hour chart highlights the formation of an ascending wedge pattern. A reversal may come into the picture if SUSHI/USD fails to overcome the resistance at $8. The bearish outlook forms when an asset's price ascends with pivot highs and lows while converging at a single point referred to as the apex.
A breakdown usually occurs before the trendlines converge. The typical breakdown is mostly confirmed by decreasing volume (highlighting a divergence between volume and price). Breakdowns are generally fast and drastic and could revisit the 50 Simple Moving Average.
UNI/USD 4-hour chart
Similarly, Uniswap is trading at the apex of a rising wedge pattern, as highlighted on the 4-hour chart. If the upside resistance at $10 is not overcome, a correction may come into the picture, perhaps toward the 50 SMA ($7).
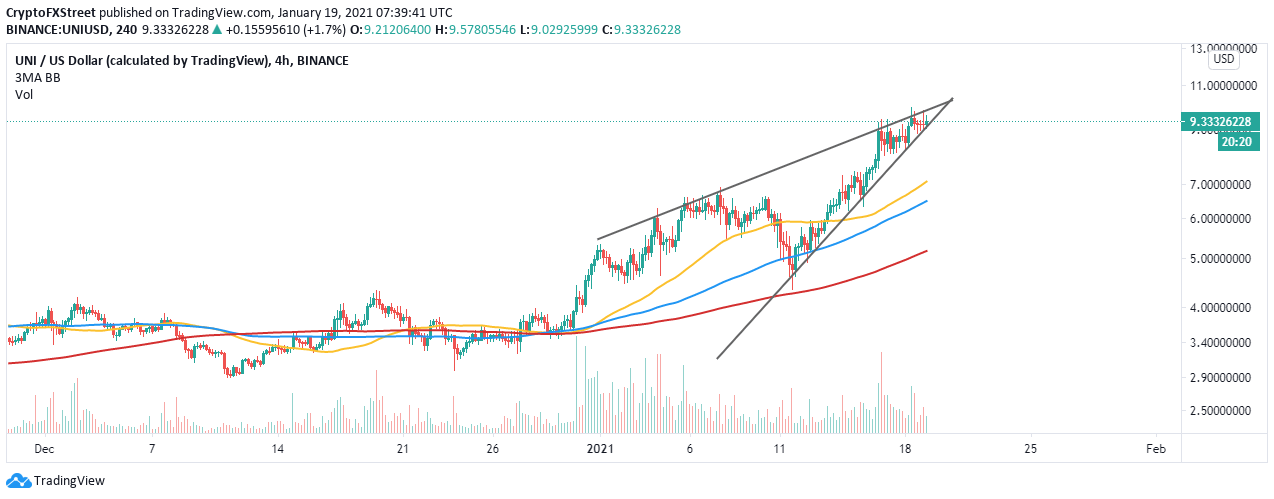
UNI/USD 4-hour chart
On the other hand, the uptrend may continue above $10 if the wedge pattern trendlines converge before breakdown. Price action above $10 may call more buy orders, thus increasing the tailwind behind UNI.
Author

John Isige
FXStreet
John Isige is a seasoned cryptocurrency journalist and markets analyst committed to delivering high-quality, actionable insights tailored to traders, investors, and crypto enthusiasts. He enjoys deep dives into emerging Web3 tren


