Decentralized Finance (DeFi) , a system where trusted third parties are not needed, is one of the fastest-growing sectors within the past two years. All interactions in the system are between the user (through web 3.0 crypto wallets) and the financial provider being the decentralized applications (DApps) without having to depend on an intermediary, meaning you have full custody of your assets during the transactions. Throughout the last two years this sector has experienced exponential growth and development in different sectors that form the DeFi ecosystem. One of the major drivers of DeFi’s growth are Decentralized Exchanges (DEXes) which consist of protocols that offer a trading platform in a decentralized manner. DeFi offers benefits in privacy and security, but besides this, crypto users are also adopting this new technology to gain advantage of several yield generating strategies available in the ecosystem.
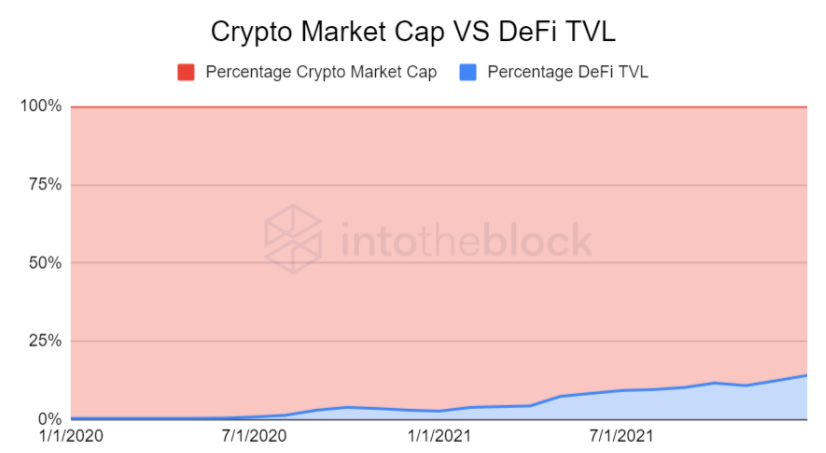
In order to analyze this growth, we measured the entire cryptocurrency market cap in relation to DeFi’s Total Value Locked (TVL) going back two years. This indicator allows us to gauge the percentage of the crypto market which has deposited money into DApps in order to generate yield.
Source: IntoTheBlock
The indicator depicts a clear growth in DeFi’s TVL in relation to crypto’s market cap. DeFis’ TVL went from having 0.39% of the market in January 2020 to holding around 14% two years later in January 2022. It's important to keep this trend into account because it depicts the amount of crypto users that are familiar with this emerging DeFi ecosystem and also the ones that are willing to get themselves involved with DApps in order to try and gain some yield on their holdings.
Inside the DeFi ecosystems we can find different types of DApps with different use cases, services differentiating one from each other. Among the most common types of DApps are: decentralized exchanges, lending protocols and derivatives protocols.
DEXes main task as an exchange service provider is to have liquidity in order to be able to offer the pair being traded at the time. How do DEXes do it? Users are allowed to deposit pairs of tokens into open pools offered by each different protocol.
These depositors then start gaining swap fees charged to those using the DEX services to trade.
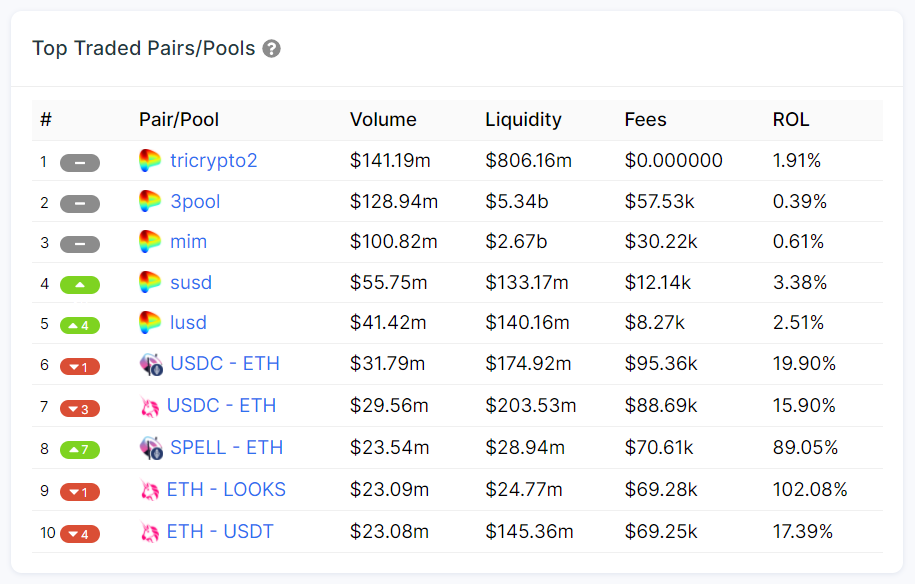
IntoTheBlock identifies and ranks the most traded pairs/pools across the supported DEXes. This indicator helps to track the pools with greater liquidity and volume across the ecosystem.
Via IntoTheBlock’s DeFi Insights, as of Jan. 26, 2022
The indicator shows the top 10 pools ranked by volume traded. The volume column aggregates 24-hour trading volume. Liquidity is the total amount supplied from both tokens in this trading pair. The fees are a function of the trading volume (0.3% in the case of Uniswap) and are earned by liquidity providers, in this case the indicator shows the fees collected in the last 24h. Finally, the return on liquidity (ROL) is the projected return, excluding token rewards, liquidity providers obtain from this pair based on 24-hour data. In this case ranked as number 9 we can see the ETH - LOOKS pool traded on Uniswap with a 102.08% of ROL, in this escenario the pool has experienced great volume of transactions in relation to the liquidity that is being provided at the time. That is why it offers a relatively high ROL.
ROL varies depending on the volume traded and the liquidity being provided at the time. It works as a relation between the two: the more volume being traded entails more fees generated which results in higher rewards for the liquidity providers. The less liquidity being provided to a pool also equals to a greater share of the pool, if the pool has high trading volume the greater the rewards for the liquidity providers.
When providing liquidity, it's also important to take some other risks into account. The major one being impermanent loss. Most pools require a balanced 50% - 50% deposit between the pairs. Impermanent loss refers to when a pool has to rebalance its assets to ensure equal value for both sides of it. In specific the problem comes when one of the tokens being deposited has an increase or decrease in value in relation with the other token being deposited. Automatically the pool rebalances this difference and leaves the LP with a loss of tokens, at least temporarily.
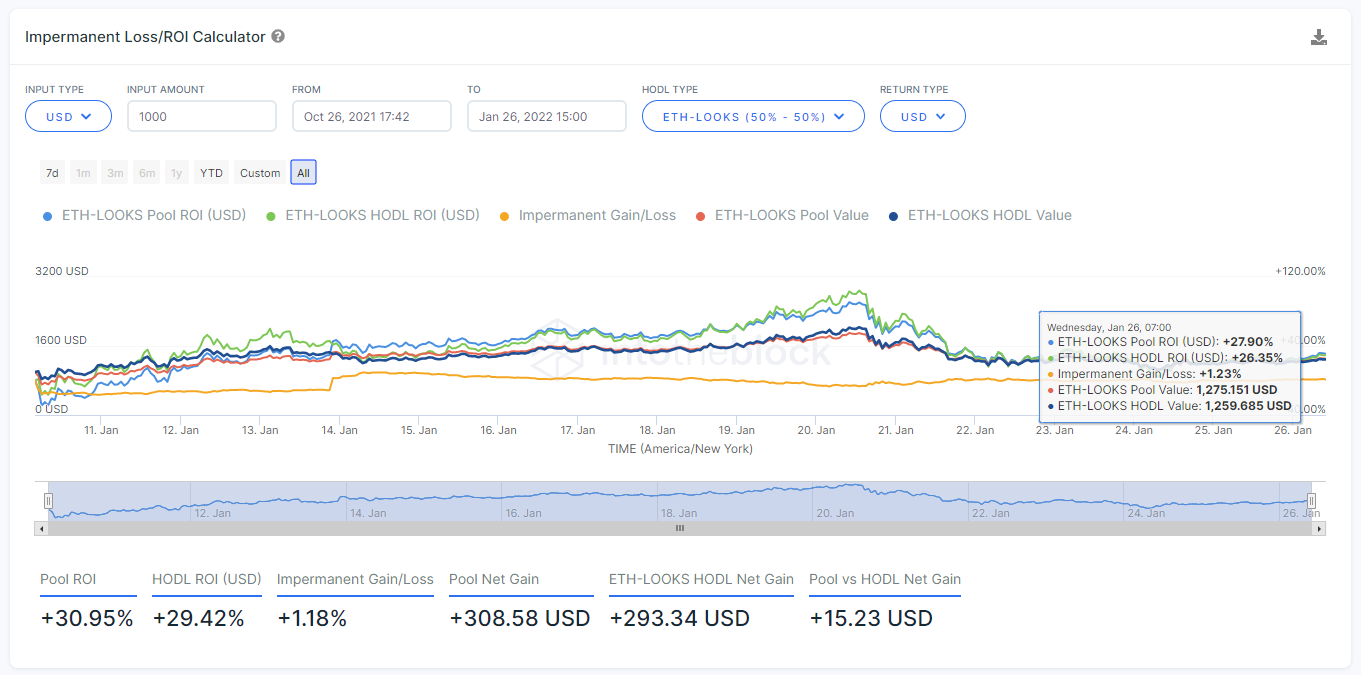
At IntoTheBlock we offer a graphically displayed Impermanent Loss/ROI Calculator. This calculator helps to track the impermanent loss based on your liquidity provided.
Via IntoTheBlock’s DeFi Insights, as of Jan. 26, 2022
The indicator compares in a simulation depending on your input amount, the return on investment (ROI) in comparison if you had simply held (hodl) the tokens, assets you were holding (hodl type) and gives as output the different scenarios. In this case we are tracking the ETH - LOOKS pool going back to October 26th of 2021.
Following the example of the ETH-LOOKS pool, we can track the returns being generated by liquidity providers. For instance, if an LP had deposited $1,000 split evenly between ETH and LOOKS into the pool on Oct 26, 2021 they would have gained 30.95%, while holding these two assets separately would have netted them 29.42% gain. Therefore in this case, factoring the massive market decrease, it would have been beneficial for LPs to supply liquidity to this pool, generating them a higher relative return.
DeFi is a nascent and complex ecosystem that shows great potential. Its growing TVL now represents an important part of the crypto sector. Currently there are great opportunities to get involved with the market and generate yield on your assets.
It's important to keep in mind and look out for certain risks that come along dealing with DeFi like high gas prices or impermanent loss in the case of LP’S on DEXes.
The content herein is not intended to be used as financial or investment advice. The author may hold a position in the asset(s) mentioned in the article.
Recommended Content
Editors’ Picks

Top 3 Price Prediction Bitcoin, Ethereum, Ripple: Bulls target $100,000 BTC, $2,000 ETH, and $3 XRP
Bitcoin (BTC) is stabilizing around $95,000 at the time of writing on Wednesday, and a breakout suggests gains toward $100,000. Ethereum (ETH) and Ripple (XRP) followed BTC’s footsteps and hovered around their key levels.

Tether mints 3 billion USDT on Ethereum and TRON as markets stabilize
Tether ramps up its minting activity amid surging demand for stablecoins, often signaling heightened trading and liquidity needs. The issuer of the leading stablecoin by market capitalization has minted 2 billion USDT on Ethereum and an additional 1 billion USDT on the TRON network.

SEC delays decision on Franklin Templeton’s spot XRP ETF to June 2025
The Securities and Exchange Commission (SEC) has postponed its decision on Franklin Templeton’s spot XRP ETF, extending the review period to June 17, 2025. XRP traded at approximately $2.24 at press time, rising 7% over the past week, according to CoinGecko.

Trump Media announces new token launch and native crypto wallet in latest Shareholder letter
Trump Media unveils plans to launch a utility token and crypto wallet to monetize Truth Social and expand its streaming services. Markets react with a 10% drawdown on the Solana-hosted official TRUMP memecoin.

Bitcoin Weekly Forecast: BTC consolidates after posting over 10% weekly surge
Bitcoin (BTC) price is consolidating around $94,000 at the time of writing on Friday, holding onto the recent 10% increase seen earlier this week.

The Best brokers to trade EUR/USD
SPONSORED Discover the top brokers for trading EUR/USD in 2025. Our list features brokers with competitive spreads, fast execution, and powerful platforms. Whether you're a beginner or an expert, find the right partner to navigate the dynamic Forex market.


