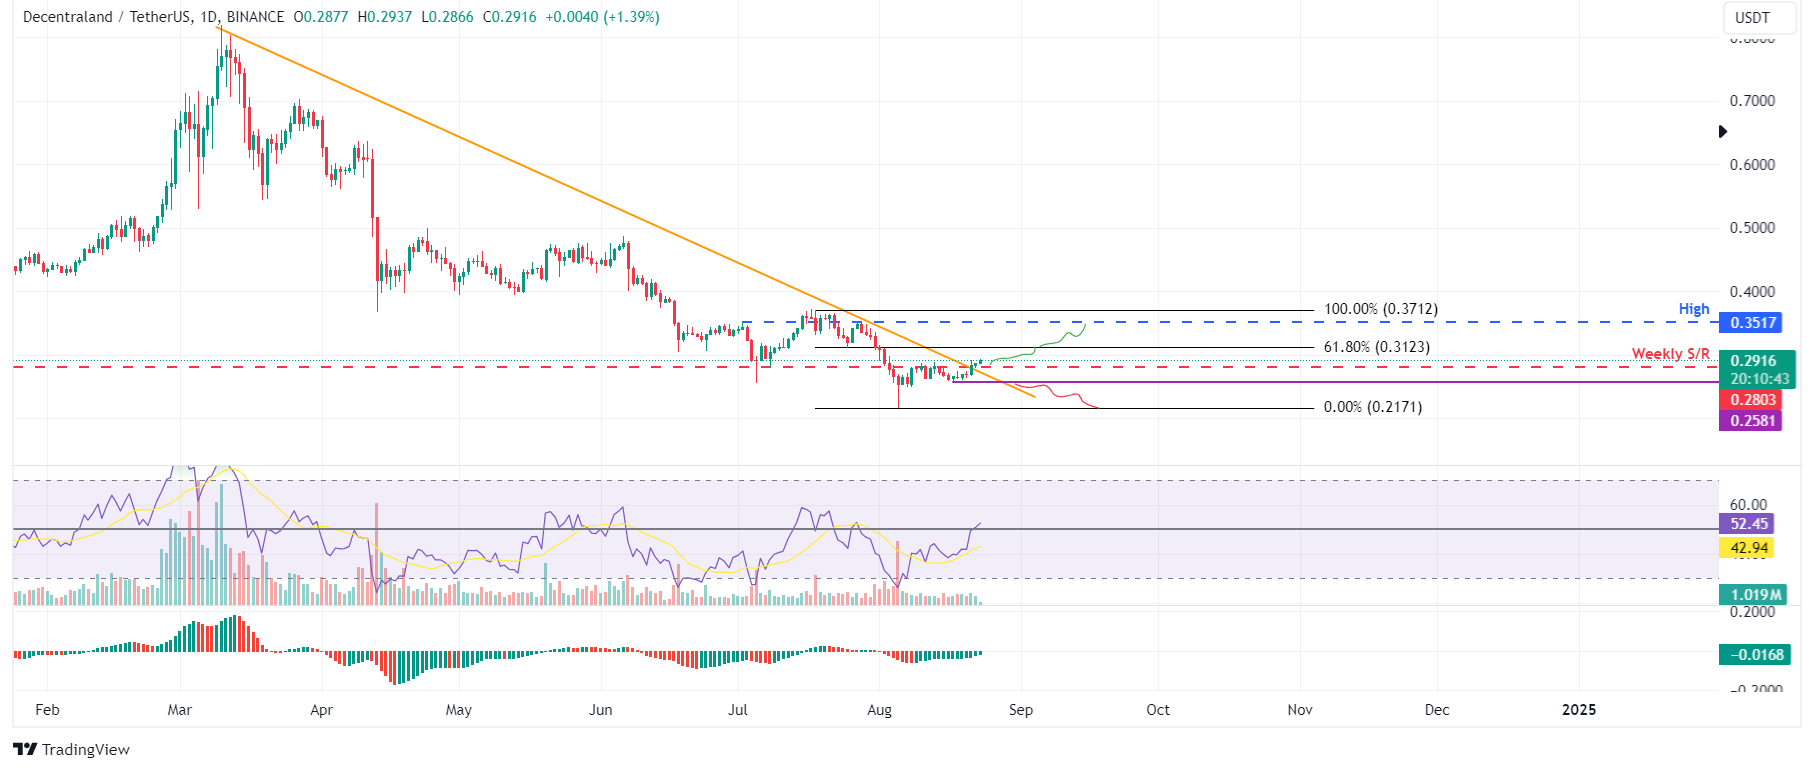
- Decentraland price broke above the descending trendline, signaling a bullish trend ahead.
- On-chain data paints a bullish picture, with MANA's Exchange Flow balance showing a negative spike and the long-to-short ratio above one.
- A daily candlestick close below $0.258 would invalidate the bullish thesis.
Decentraland (MANA) price broke above the descending trendline and trades up 1.5% as of Friday at $0.291. Additionally, on-chain data support further price gains, as MANA's Exchange Flow Balance shows a negative spike, and the long-to-short ratio stays above one.
Decentraland price is poised for an upleg after breaking above its descending trendline
Decentraland price broke out of the descending trendline drawn by connecting multiple high levels from mid-March on Wednesday and rose 1% on Thursday. At the time of writing, it continues trading up 1.5% at $0.291 on Friday.
If the trendline breakout level acts as support around $0.280, its weekly support level, MANA could rise to $0.312 before potentially rallying by 25% to revisit its July 27 high of $0.351.
The Relative Strength Index (RSI) on the daily chart is trading above its neutral level of 50, and the Awesome Oscillator (AO) is approaching its neutral level of zero. Both indicators must trade above their respective neutral levels for the bullish momentum to be sustained.

MANA/USDT daily chart
Santiment's Exchange Flow Balance for MANA shows the net flow of tokens into and out of exchange wallets. A positive value indicates more MANA entered than exited, suggesting selling pressure from investors. A negative value indicates more MANA left the exchange than entered, indicating less selling pressure from investors.
In MANA's case, the metric has dropped from 781,450 to -935,390 from Tuesday to Wednesday, coinciding with a 5.6% price rise. This negative change indicates increased buying activity among investors.
During this event, MANA's Supply on Exchanges declined by 1% in one day, indicating investors are moving tokens out of the exchanges and holding them in their wallets, further denoting investor confidence in Decentraland.
%20[09.20.58,%2023%20Aug,%202024]-638599882636421448.png)
MANA Exchange Flow Balance and Supply on Exchanges chart
According to Coinglass's data, MANA's Binance long-to-short ratio is 1.94. This ratio reflects bullish sentiment in the market, as the number above one suggests that more trades anticipate the price of the asset to rise, bolstering Decentraland's bullish outlook.

MANA long-to-short ratio chart
Despite the bullish thesis signaled by both on-chain data and technical analysis, the outlook will shift to bearish if Decentraland's daily candlestick closes below the August 17 low of $0.258. This scenario could lead to a 16% crash to retest its low of $0.217 on August 5.
Information on these pages contains forward-looking statements that involve risks and uncertainties. Markets and instruments profiled on this page are for informational purposes only and should not in any way come across as a recommendation to buy or sell in these assets. You should do your own thorough research before making any investment decisions. FXStreet does not in any way guarantee that this information is free from mistakes, errors, or material misstatements. It also does not guarantee that this information is of a timely nature. Investing in Open Markets involves a great deal of risk, including the loss of all or a portion of your investment, as well as emotional distress. All risks, losses and costs associated with investing, including total loss of principal, are your responsibility. The views and opinions expressed in this article are those of the authors and do not necessarily reflect the official policy or position of FXStreet nor its advertisers. The author will not be held responsible for information that is found at the end of links posted on this page.
If not otherwise explicitly mentioned in the body of the article, at the time of writing, the author has no position in any stock mentioned in this article and no business relationship with any company mentioned. The author has not received compensation for writing this article, other than from FXStreet.
FXStreet and the author do not provide personalized recommendations. The author makes no representations as to the accuracy, completeness, or suitability of this information. FXStreet and the author will not be liable for any errors, omissions or any losses, injuries or damages arising from this information and its display or use. Errors and omissions excepted.
The author and FXStreet are not registered investment advisors and nothing in this article is intended to be investment advice.
Recommended Content
Editors’ Picks

Bitcoin Weekly Forecast: BTC holdings of large investors surges as Trump takes the Oval Office
Bitcoin trades in the green and hovers above $105,000 on Friday after hitting a new all-time high of $109,588 on Monday. CryptoQuant’s weekly report highlights that the demand for BTC from large investors surges as US President Donald Trump takes the Oval Office.

Dogelon Mars pumps more than 85%, whales dump 128 billion coins and realize a profit
Dogelon Mars price continues its rally on Friday after rallying more than 18% this week. On-chain data shows that ELON whale wallets realized profits during the recent surge. The technical outlook suggests a rally continuation of the dog-theme meme coin, targeting double-digit gains ahead.

XRP lose steam, risks 20% decline despite Donald Trump's presidential executive order
XRP investors realized over $500 million in profits in the past 48 hours. Short-term holders are responsible for most of the selling activity following CME's clarification on XRP futures. XRP could decline nearly 20% to $2.62 as bulls show signs of exhaustion.

Crypto market outlook 2025: PayFI report highlights AI and Memecoins as key sectors to watch
The global cryptocurrency market was sent agog this week as US President Donald Trump’s inauguration triggered a flurry of bullish catalysts. As traders navigate the volatile market trends, a Foresight ventures’ market outlook report shows key sectors to watch in the weeks ahead.

Bitcoin: BTC holdings of large investors surges as Trump takes the Oval Office
Bitcoin (BTC) trades in the green and hovers above $105,000 on Friday after hitting a new all-time high of $109,588 on Monday. CryptoQuant’s weekly report highlights that the demand for BTC from large investors surges as US President Donald Trump takes the Oval Office.

Trusted Broker Reviews for Smarter Trading
VERIFIED Discover in-depth reviews of reliable brokers. Compare features like spreads, leverage, and platforms. Find the perfect fit for your trading style, from CFDs to Forex pairs like EUR/USD and Gold.