|

Dash technical analysis: DASH/USD bulls bounce back after charting morning star pattern

  • DASH/USD went up from $110 to $114.70 this Thursday.
  • Relative strength index (RSI) indicator has bounced up from the oversold zone and is trending around 39.06.

DASH/USD daily chart

fxsoriginal

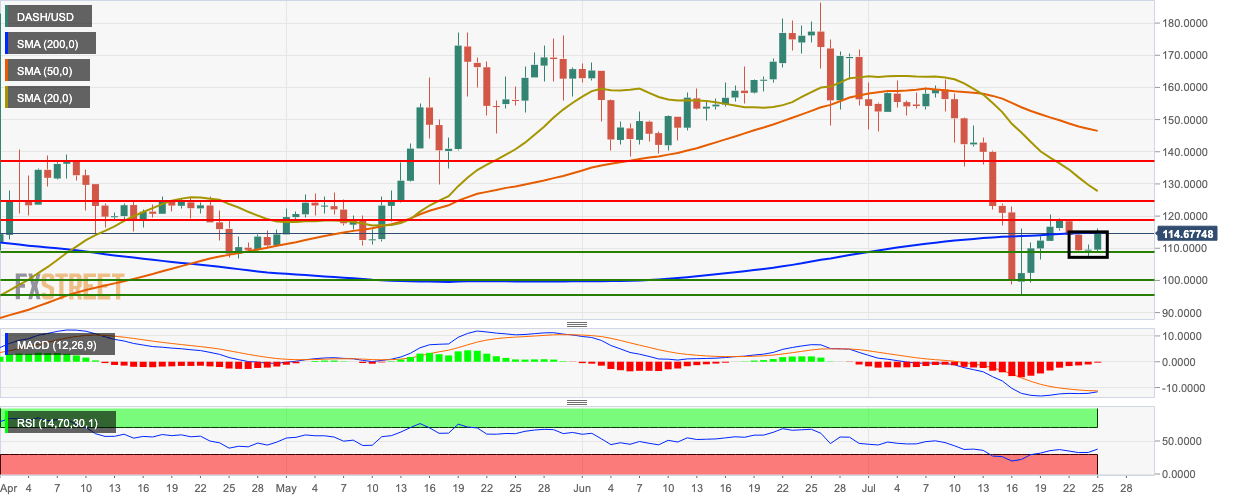
DASH/USD went up from $110 to $114.70 this Thursday. The bulls stepped in and charted the morning star pattern, changing the market sentiment from bearish to bullish. The market is trending below the 50-day simple moving average (SMA 50), SMA 20 and SMA 200 Curves. 

Relative strength index (RSI) indicator has bounced up from the oversold zone and is trending around 39.06. The moving average convergence/divergence (MACD) indicator shows that the signal line is looking to crossover the MACD line, showing decreasing bearish momentum.

DASH/USD 4-hour chart

fxsoriginal

The 4-hour price chart is trending in an upwards channel formation and above the SMA 20 and SMA 50 curves. The price was about to go above the 20-day Bollinger band before the bears managed to correct it. The Elliot oscillator shows seven straight bullish sessions.

DASH/USD hourly chart

fxsoriginal

The hourly market has found support on the red Ichimoku cloud. The hourly price shows that the market bounced up from the support level at $111.75 this Thursday. The price spiked up to $115.60, where it met resistance and then fell. The market went up and tried to break past the resistance and failed once again, before settling around $114.70.

Key Levels

DASH/USD

Overview
Today last price115.3792
Today Daily Change5.8095
Today Daily Change %5.30
Today daily open109.5697
 
Trends
Daily SMA20129.7358
Daily SMA50147.1501
Daily SMA100141.6982
Daily SMA200114.8717
Levels
Previous Daily High111.214
Previous Daily Low106.9119
Previous Weekly High140.2898
Previous Weekly Low95.498
Previous Monthly High186.5549
Previous Monthly Low138.5481
Daily Fibonacci 38.2%109.5706
Daily Fibonacci 61.8%108.5553
Daily Pivot Point S1107.2498
Daily Pivot Point S2104.9298
Daily Pivot Point S3102.9477
Daily Pivot Point R1111.5518
Daily Pivot Point R2113.5339
Daily Pivot Point R3115.8538


Author

Rajarshi Mitra

Rajarshi Mitra

Independent Analyst

Rajarshi entered the blockchain space in 2016. He is a blockchain researcher who has worked for Blockgeeks and has done research work for several ICOs. He gets regularly invited to give talks on the blockchain technology and cryptocurrencies.

More from Rajarshi Mitra
Share:

Editor's Picks

Bitcoin, Ethereum and Ripple consolidate after massive sell-off

Bitcoin, Ethereum, and Ripple prices consolidated on Monday after correcting by nearly 9%, 8%, and 10% in the previous week, respectively. BTC is hovering around $70,000, while ETH and XRP are facing rejection at key levels. Traders should be cautious: despite recent stabilization, upside recovery for these top three cryptocurrencies is capped as the broader trend remains bearish.

Ethereum: Trend Research capitulates, BitMine's Thomas Lee sees a V-shaped recovery

Ethereum had one of its sharpest historic declines over the past 10 days, shedding 40% of its value and briefly sliding below $2,000. The dip also saw ETH move below its realized price, or the average cost basis of investors — an occurrence that has historically accelerated selling pressure as investors cut losses.

Why Bitcoin and top cryptos are falling: Bitwise

The crypto market crash since October isn't down to a single factor but a combination of several, according to Bitwise CIO Matt Hougan. In a note to investors on Friday, Hougan outlined six key factors that potentially contributed to the crash that pushed down nearly every top crypto by more than 50% from prices seen over four months ago.

XRP recovery gains momentum despite retail market decline

Ripple is accelerating its recovery, trading above $1.36 at the time of writing on Friday, as investors adjust their positions following a turbulent week in the broader crypto market. The remittance token is up over 21% from its intraday low of $1.12.

Bitcoin Price Annual Forecast: BTC holds long-term bullish structure heading into 2026

Bitcoin (BTC) is wrapping up 2025 as one of its most eventful years, defined by unprecedented institutional participation, major regulatory developments, and extreme price volatility.

Bitcoin: The worst may be behind us

Bitcoin (BTC) price recovers slightly, trading at $65,000 at the time of writing on Friday, after reaching a low of $60,000 during the early Asian trading session. The Crypto King remained under pressure so far this week, posting three consecutive weeks of losses exceeding 30%.