- DASH/USD’s path of least resistance appears north.
- Inverse head-and-shoulders breakout confirmed on the 1H chart.
- Bullish crossover and RSI back the case for additional upside.
Dash (DASH/USD) bulls take a breather just under the $110 level after the renewed uptick.
Dash, one of the top 50 widely traded crypto assets, adds 12% over the past 24 hours, although is poised to end this rollercoaster week in the red zone.
In the second half of the week, the DASH bulls regained control, looking to extend the recovery mode into Saturday.
DASH: Bulls back in command amid favorable technicals
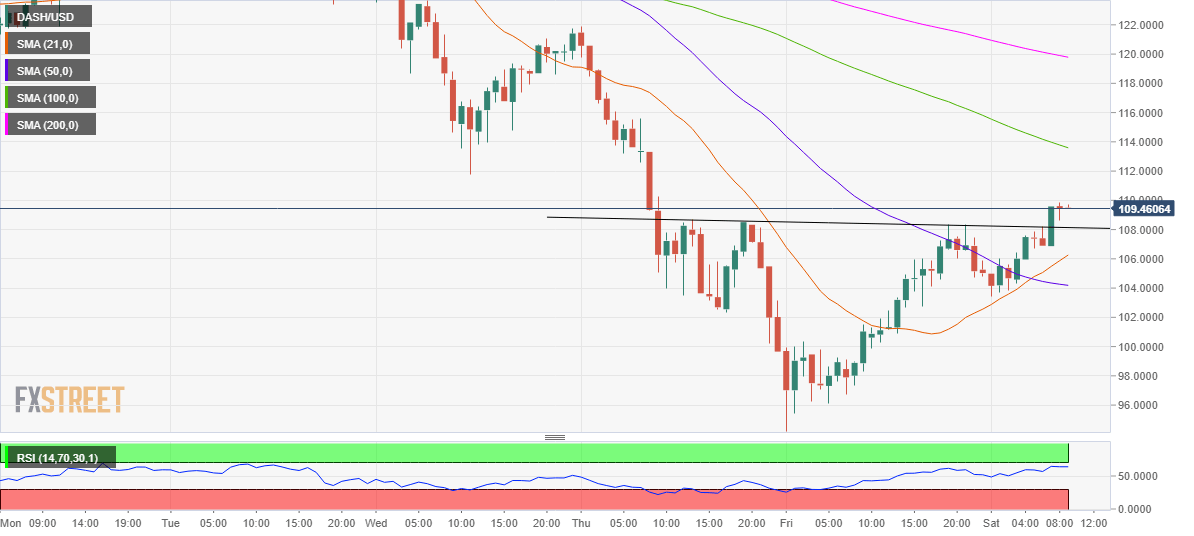
DASH/USD: Hourly chart
From a near-term technical perspective, the altcoin broke through the trendline resistance at $108.15, validating an inverse head-and-shoulders breakout on the hourly chart.
The bullish crossover, with the 21-hourly moving average (HMA) having cut above the 50-HMA, has also strengthened the case for further upside.
Therefore, the DASH bulls now aim for the pattern target measured at $122. Ahead of that the bearish 100-HMA at $113.77 could test the bulls’ commitment.
A sustained move above the latter, the critical downward-sloping 200-HMA at $120 would be tested. The Relative Strength Index (RSI) holds at higher levels, now at 63.84, pointing to more gains in the offing.
On the flip side, the inverse head-and-shoulders neckline resistance now support at $108.15 could offer an initial cushion.
The bullish 21-HMA at $105.87 is likely to offer strong support, protecting the bulls against any downside pressures.
The sellers could also aim for the 50-HMA cap at $104.19 if the abovementioned support gives way.
All in all, the path of least resistance appears to the upside in the near-term.
DASH/USD: Additional levels
Information on these pages contains forward-looking statements that involve risks and uncertainties. Markets and instruments profiled on this page are for informational purposes only and should not in any way come across as a recommendation to buy or sell in these assets. You should do your own thorough research before making any investment decisions. FXStreet does not in any way guarantee that this information is free from mistakes, errors, or material misstatements. It also does not guarantee that this information is of a timely nature. Investing in Open Markets involves a great deal of risk, including the loss of all or a portion of your investment, as well as emotional distress. All risks, losses and costs associated with investing, including total loss of principal, are your responsibility. The views and opinions expressed in this article are those of the authors and do not necessarily reflect the official policy or position of FXStreet nor its advertisers. The author will not be held responsible for information that is found at the end of links posted on this page.
If not otherwise explicitly mentioned in the body of the article, at the time of writing, the author has no position in any stock mentioned in this article and no business relationship with any company mentioned. The author has not received compensation for writing this article, other than from FXStreet.
FXStreet and the author do not provide personalized recommendations. The author makes no representations as to the accuracy, completeness, or suitability of this information. FXStreet and the author will not be liable for any errors, omissions or any losses, injuries or damages arising from this information and its display or use. Errors and omissions excepted.
The author and FXStreet are not registered investment advisors and nothing in this article is intended to be investment advice.
Recommended Content
Editors’ Picks

XRP gains as traders gear up for futures ETFs debut this week
XRP climbs over 3% on Monday, hovering around $2.33 at the time of writing. The rally is likely catalyzed by key market movers like XRP futures Exchange Traded Funds (ETFs) approval by the US financial regulator, the Securities and Exchange Commission (SEC), and a bullish outlook.

Bitcoin Price Forecast: BTC eyes $97,000 as institutional inflow surges $3.06 billion in a week
Bitcoin (BTC) price is stabilizing above $94,000 at the time of writing on Monday, following a 10% rally the previous week. The institutional demand supports a bullish thesis, as US spot Exchange Traded Funds (ETFs) recorded a total inflow of $3.06 billion last week, the highest weekly figure since mid-November.

Ethereum Price Forecast: ETH ETFs post first weekly inflows since February
Ethereum (ETH) recovered the $1,800 price level on Saturday after US spot Ether ETFs (exchange-traded funds) recorded their first weekly inflows since February.

Defi Development Corporation files to offer $1 billion in securities to boost its Solana holdings
Defi Development Corporation (formerly Janover) filed a registration statement with the Securities & Exchange Commission (SEC) on Friday, signaling its intent to offer and sell a wide range of securities, including common and preferred stock, debt instruments and warrants for the purchase of equity

Bitcoin Weekly Forecast: BTC consolidates after posting over 10% weekly surge
Bitcoin (BTC) price is consolidating around $94,000 at the time of writing on Friday, holding onto the recent 10% increase seen earlier this week.

The Best brokers to trade EUR/USD
SPONSORED Discover the top brokers for trading EUR/USD in 2025. Our list features brokers with competitive spreads, fast execution, and powerful platforms. Whether you're a beginner or an expert, find the right partner to navigate the dynamic Forex market.