- Dash spikes above $300 after triggering a technical pattern breakout.
- Extending the uptrend to $600 will depend on the bulls’ ability to break above the hurdle at $340.
- A correction may come into the picture, especially now that the RSI is in the overbought region.
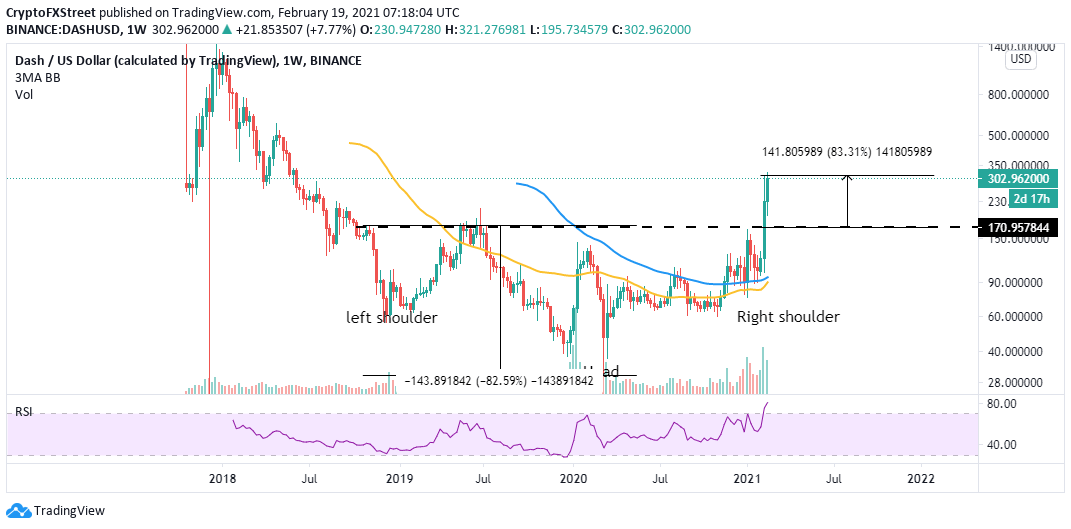
The Dash rally is catching momentum after achieving its technical breakout target. At the time of writing, the token is seeking support above $300. A comprehensive look at the weekly chart shows that the rally is halfway to $600.
The inverse H&S pattern sets Dash on the launchpad
The inverse head-and-shoulders is a bullish pattern in technical analysis. A break above the horizontal line results in a drastic upswing resembling Dash from $170 to marginally above $300. If the next crucial hurdle at $340 is broken, DASH may rally toward $600.
Meanwhile, the Relative Strength Index continues to move higher within the overbought region. Moreover, a golden cross pattern is likely to come into the picture on the weekly chart with the 50 Simple Moving Average (SMA) crossing above the longer-term 100 SMA.
DASH/USD weekly chart
The IOMAP model by IntoTheBlock reveals that little resistance is ahead of Dash. In other words, gains are likely to increase with bulls increasing their grip. However, some attention must be channelled to the region between $325 and $335. Here, nearly 4,800 addresses purchased roughly 52,700 DASH. This a subtle resistance that may not do much to hinder the rally to higher levels.
On the downside, Dash sits on areas with immense support, mostly between $270 and $280. Here, 14,800 addresses previously bought nearly 361,000 DASH. Slicing through this zone may not be easy, thus adding weight to the bullish outlook.
Dash IOMAP model
Looking at the other side of the fence
Dash may fail to hold the rally if the resistance at $340 remains unshaken. The RSI is not in the overbought region, which means that investors have to proceed with caution. A correction from the current levels will test support at $300. If push comes to shove, declines will continue to $280.
Information on these pages contains forward-looking statements that involve risks and uncertainties. Markets and instruments profiled on this page are for informational purposes only and should not in any way come across as a recommendation to buy or sell in these assets. You should do your own thorough research before making any investment decisions. FXStreet does not in any way guarantee that this information is free from mistakes, errors, or material misstatements. It also does not guarantee that this information is of a timely nature. Investing in Open Markets involves a great deal of risk, including the loss of all or a portion of your investment, as well as emotional distress. All risks, losses and costs associated with investing, including total loss of principal, are your responsibility. The views and opinions expressed in this article are those of the authors and do not necessarily reflect the official policy or position of FXStreet nor its advertisers. The author will not be held responsible for information that is found at the end of links posted on this page.
If not otherwise explicitly mentioned in the body of the article, at the time of writing, the author has no position in any stock mentioned in this article and no business relationship with any company mentioned. The author has not received compensation for writing this article, other than from FXStreet.
FXStreet and the author do not provide personalized recommendations. The author makes no representations as to the accuracy, completeness, or suitability of this information. FXStreet and the author will not be liable for any errors, omissions or any losses, injuries or damages arising from this information and its display or use. Errors and omissions excepted.
The author and FXStreet are not registered investment advisors and nothing in this article is intended to be investment advice.
Recommended Content
Editors’ Picks

Bitcoin holds $84,000 despite Fed’s hawkish remarks and spot ETFs outflows
Bitcoin is stabilizing around $84,000 at the time of writing on Thursday after facing multiple rejections around the 200-day EMA at $85,000 since Saturday. Despite risk-off sentiment due to the hawkish remarks by the US Fed on Wednesday, BTC remains relatively stable.

Crypto market cap fell more than 18% in Q1, wiping out $633.5 billion after Trump’s inauguration top
CoinGecko’s Q1 Crypto Industry Report highlights that the total crypto market capitalization fell by 18.6% in the first quarter, wiping out $633.5 billion after topping on January 18, just a couple of days ahead of US President Donald Trump’s inauguration.

Top meme coin gainers FARTCOIN, AIDOGE, and MEW as Trump coins litmus test US SEC ethics
Cryptocurrencies have been moving in lockstep since Monday, largely reflecting sentiment across global markets as United States (US) President Donald Trump's tariffs and trade wars take on new shapes and forms each passing day.

XRP buoyant above $2 as court grants Ripple breathing space in SEC lawsuit
A US appellate court temporarily paused the SEC-Ripple case for 60 days, holding the appeal in abeyance. The SEC is expected to file a status report by June 15, signaling a potential end to the four-year legal battle.
Bitcoin Weekly Forecast: Market uncertainty lingers, Trump’s 90-day tariff pause sparks modest recovery
Bitcoin (BTC) price extends recovery to around $82,500 on Friday after dumping to a new year-to-date low of $74,508 to start the week. Market uncertainty remains high, leading to a massive shakeout, with total liquidations hitting $2.18 billion across crypto markets.

The Best brokers to trade EUR/USD
SPONSORED Discover the top brokers for trading EUR/USD in 2025. Our list features brokers with competitive spreads, fast execution, and powerful platforms. Whether you're a beginner or an expert, find the right partner to navigate the dynamic Forex market.