• Dash announced protocol versioning following its latest update.
  • DASH jumped up from 68.20 to 76.25 over the last two days.

Dash announces protocol versioning

Dash announced that it would be introducing several new features in its latest update, including protocol versioning. This will be Dash’s fourth update. The new features are being added to help developers to transition smoothly to a testnet and mainnet. Previously, they were forced to wipe data on Evonet and update their platform. This wasn’t the most efficient of methods, as the company pointed out: 

While this approach is fine for early testing, it is not appropriate for testnet and mainnet. To handle different versions of data, nodes, and clients all working in coordination, DCG developers introduced versioning that allows for the smooth rollout of breaking changes without affecting user experience.

Other new features include binary fields definition in a data contract, improvements in the Dash Platform Name Service, the JavaScript library, distribution package and changes to the DAPI endpoints.

DASH/USD daily chart

DASH/USD daily chart

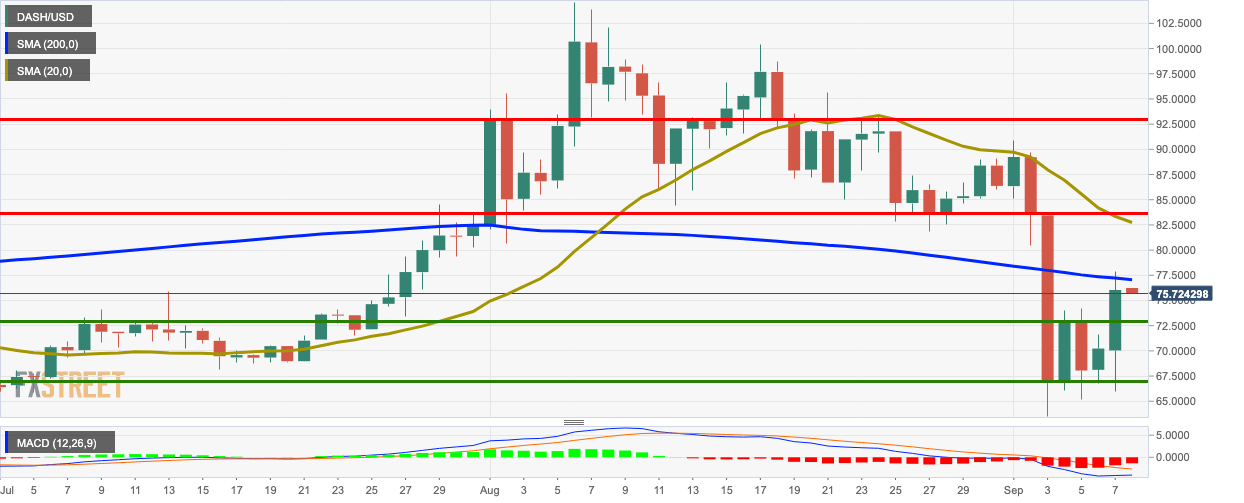
DASH has gone down very slightly from $76.24 to $75.66 in the early hours of Tuesday. Before this, the bulls jumped the price up from 68.20 to 76.25, charting an impressive 11.97% growth over the last two days. If the buyers want to gain back control, they will need first to overcome resistance at the SMA 200 curve.

DASH In/Out analysis

fxsoriginal

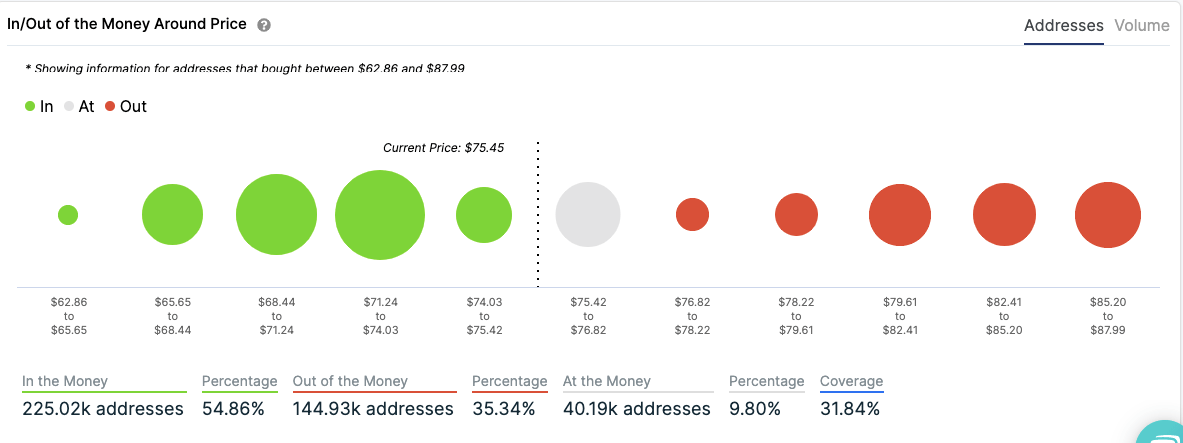
As per Into the Block’s In/Out money metric, DASH/USD should be able to go up to $79.60. However, following that, the bulls will have a hard time entering the $80-zone as the next few price levels are guarded by intense resistance levels.

On the other hand, if the sellers take control, they will only be able to take the price down to $74 before encountering healthy support. As such, the downside potential for DASH looks pretty limited.

Key levels

DASH/USD

Overview
Today last price 75.6146
Today Daily Change -0.4257
Today Daily Change % -0.56
Today daily open 76.0403
 
Trends
Daily SMA20 83.348
Daily SMA50 85.1591
Daily SMA100 78.7321
Daily SMA200 77.2211
 
Levels
Previous Daily High 77.8646
Previous Daily Low 66.0152
Previous Weekly High 90.8577
Previous Weekly Low 63.536
Previous Monthly High 104.6218
Previous Monthly Low 80.6278
Daily Fibonacci 38.2% 73.3381
Daily Fibonacci 61.8% 70.5417
Daily Pivot Point S1 68.7488
Daily Pivot Point S2 61.4573
Daily Pivot Point S3 56.8994
Daily Pivot Point R1 80.5982
Daily Pivot Point R2 85.1561
Daily Pivot Point R3 92.4476


Note: All information on this page is subject to change. The use of this website constitutes acceptance of our user agreement. Please read our privacy policy and legal disclaimer. Opinions expressed at FXstreet.com are those of the individual authors and do not necessarily represent the opinion of FXstreet.com or its management. Risk Disclosure: Trading foreign exchange on margin carries a high level of risk, and may not be suitable for all investors. The high degree of leverage can work against you as well as for you. Before deciding to invest in foreign exchange you should carefully consider your investment objectives, level of experience, and risk appetite. The possibility exists that you could sustain a loss of some or all of your initial investment and therefore you should not invest money that you cannot afford to lose. You should be aware of all the risks associated with foreign exchange trading, and seek advice from an independent financial advisor if you have any doubts.

Join Telegram

Recommended content


Recommended Content

Editors’ Picks

Ripple on-chain metrics show bullish signs amidst legal struggle with SEC, XRP eyes recovery

Ripple on-chain metrics show bullish signs amidst legal struggle with SEC, XRP eyes recovery

Ripple made a comeback above $0.48 on Tuesday and hovers above that level in Wednesday’s European session. Ripple on-chain metrics such as transaction volume and Network Realized Profit/Loss have turned bullish, supporting a recovery in the altcoin. 

More Ripple News

Bitcoin price falls amidst German government transfers, miners activity

Bitcoin price falls amidst German government transfers, miners activity

Bitcoin (BTC) extends correction on Wednesday and hovers around $61,000 after finding resistance near the $64,000 level on Monday. Recent on-chain data indicates heightened selling activity from Bitcoin miners early in the week. 

More Bitcoin News

Crypto Today: Bitcoin erases gains from end of June, Ethereum declines while Ripple holds

Crypto Today: Bitcoin erases gains from end of June, Ethereum declines while Ripple holds

Bitcoin wipes out gains from the last week of June and falls below $60,000 on Wednesday. Ethereum and top altcoins ranked by market capitalization erased gains as the inflation outlook worsened. Ripple holds on to recent gains and hovers above $0.48 on Wednesday. 

More Cryptocurrencies News

Three reasons why altcoins could shake off losses this week

Three reasons why altcoins could shake off losses this week

On-chain data from Santiment shows that altcoins are currently in the opportunity zone, or generating buy signals. The top three altcoins in the buy zone are Basic Attention Token (BAT), Chromia (CHR), and Highstreet (HIGH), per Santiment. 

More Altcoins News

Bitcoin: BTC price correction could end in July, according to seasonal data

Bitcoin: BTC price correction could end in July, according to seasonal data

Bitcoin (BTC) price appears poised for a decline this week, influenced by slight outflows in US spot ETFs, selling activity among BTC miners, and a combined transfer of 4,690.28 BTC to centralized exchanges by the US and German governments.

Read full analysis

BTC

ETH

XRP