Top 3 Performers Of The Week: Maker, OMG Network and Zcash lead recovery
- Maker looks forward to rallying to $700, especially if the ascending channel resistance is broken.
- The 50 SMA could delay OMG Network recovery to $4.4.
- Zcash is trading at the apex of a symmetrical triangle, likely to kick start a new uptrend.

The digital space has experienced a menacing snarl-up in recoveries this week. Moreover, many assets in the top 50 have recorded losses above 15% over the last seven days. However, some selected cryptocurrencies defied the bearish wave to lead the market in recovery. They include Maker (MKR), up 18%, OMG Network (OMG), up 23% and Zcash (ZEC) up 19%.
All three digital assets were covered during FXStreet's regular coverage. Still, as the week grinds to a halt, this article will explore the force behind the remarkable performances and whether they will continue with the uptrend in the coming week.
Maker's breakout to $700 in the offing
The decentralized finance (DeFi) token has been on an upward roll since mid-September after finding support at $440. The support played a crucial role in stopping the extended retreat from August highs at $850. Over the last two weeks, Maker has embarked on a recovery process that has seen it step above some key levels, including $480 and $560.
Meanwhile, the token is trading at $575 while dealing with the ascending parallel channel middle boundary resistance. There is plenty of room for growth, especially if this resistance is flipped into support. The Relative Strength Index (RSI) highlights the bulls' return and probably a delay in the journey to $700. A break above the zone at $600 will help shift the bulls' focus to $700.
MKR/USD 4-hour chart
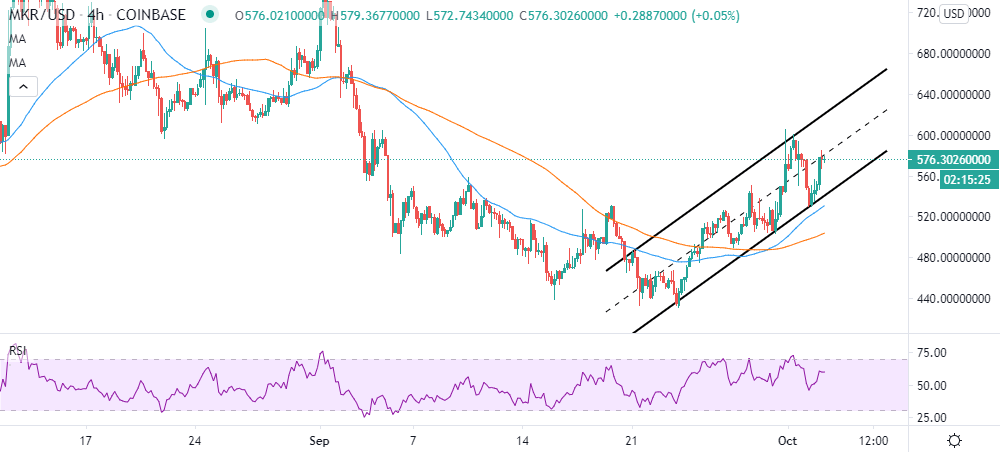
If losses come into the picture, the channel's lower boundary will support cushion MKR from falling further. The 50 Simple Moving Average is in line to offer support if the declines progress towards $520. Other vital levels to keep in mind include the 100 SMA (slightly above $500) in the 4-hour timeframe, $480, and $400.
IntoTheBlock's "Daily Active Addresses" metric highlights an increase in the number of new addresses joining the network over the last few days. For instance, addresses have shot up from 133 on September 27 to 993 by October 2. If the metric continues to record a spike in the coming days, it will be considered a significant bullish sign for MKR.
Maker new addresses chart
-637373233652981778.png)
OMG Network facing challenges towards $4.4
After an impressive 23% rally in the last seven days, OMG is trading at $3.8. On the downside, immediate support has been embraced at $3.7. Besides, the ascending channel support is providing anchorage to an ongoing bullish action. The RSI is closing in on the midline, although gradually. All the same, the trend indicator highlights a growing bullish grip.
On the upside, resistance is anticipated at the 50 SMA in the 1-hour timeframe. A close above this level would give OMG/USD a boost above the channel resistance, which could start recovery to $4.4.
OMG/USD hourly chart
 (4)-637373227895795754.png)
IntoTheBlock's IOMAP model suggests robust resistance towards $4.4. The biggest hurdle lies between $3.9 and $4. Previously, 1,700 addresses bought 7.6 million OMG. The selling pressure in this zone seems strong enough to absorb the buying pressure, thereby delaying recovery to $4.4. On the flip side, the immediate support lies between $3.4 and $3.5. Here 1,600 addresses previously purchased 5.75 million OMG.
OMG IOMAP chart
-637373228251904691.png)
Zcash consolidates ahead of a breakout
The last seven days have been incredible for Zcash after recovery from support at $50. However, the bullish action hit pause at $68, paving the way for losses under $6. At the moment, short term support at $58 has contributed to gains back into the $ 60's range. Meanwhile, the privacy-oriented token is teetering at $63 amid short term consolidation within a symmetrical triangle. The RSI highlights the sideways trading as it levels at the midline.
ZEC/USD 1-hour chart
 (1)-637373229041951908.png)
At the same time, ZEC is trading between the 50 SMA resistance and 100 SMA support in the hourly range. A breakout above the triangle could open the road for a close above the 50 SMA and gains towards $70. On the flip side, the 100 SMA is in line to offer initial support if losses take precedence in the coming sessions.
Zcash social volume chart
 [14.30.10, 03 Oct, 2020]-637373229653531069.png)
According to Santiment, a leading provider of on-chain data, Zcash's social volume has gone down significantly following a spike on September 30. The decrease in social volume is reminiscent of the consolidation and the declining volume. A breakout from the symmetrical triangle could coincide with a return in social volume and, eventually, a price growth.
Author

John Isige
FXStreet
John Isige is a seasoned cryptocurrency journalist and markets analyst committed to delivering high-quality, actionable insights tailored to traders, investors, and crypto enthusiasts. He enjoys deep dives into emerging Web3 tren


