SUI expecting the final bullish wave to break above $5
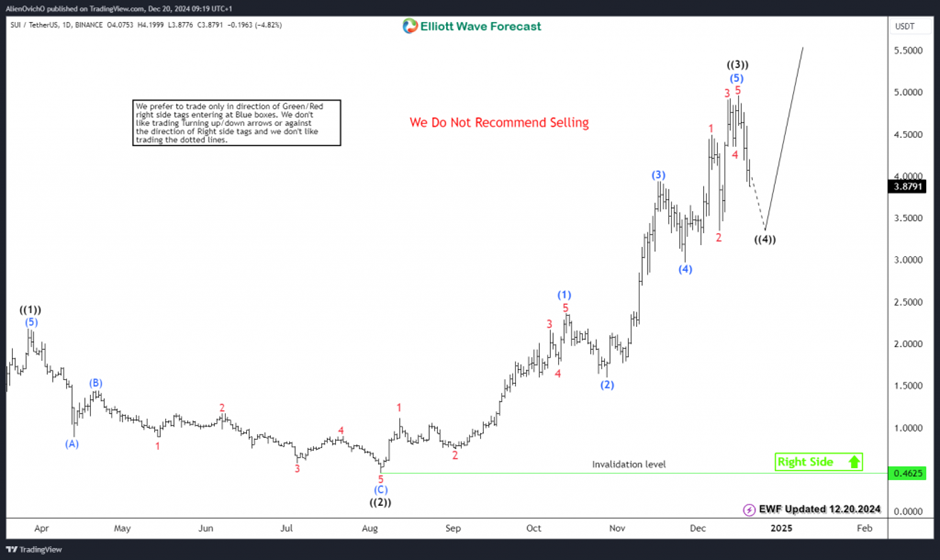
Since our previous Video blog about SUI, the coin rallied more than 900%. Therefore, we’ll be looking at the daily Elliott Wave Structure and explain the current structure within the cycle.
The recent daily rally started in August 2024, SUI established an impulsive 5 waves structure to the upside within wave ((3)). In addition, it reached the 1.618 Fibonacci extension area around $4.7 before ending the cycle. The coin, is currently showing 3 swings from all time lows and consequently it’s expected to finish 4th swing pullback then start another 5th swing to the upside.
Bitcoin Weekly Forecast: BTC nosedives below $95,000 as spot ETFs record highest daily outflow since launch
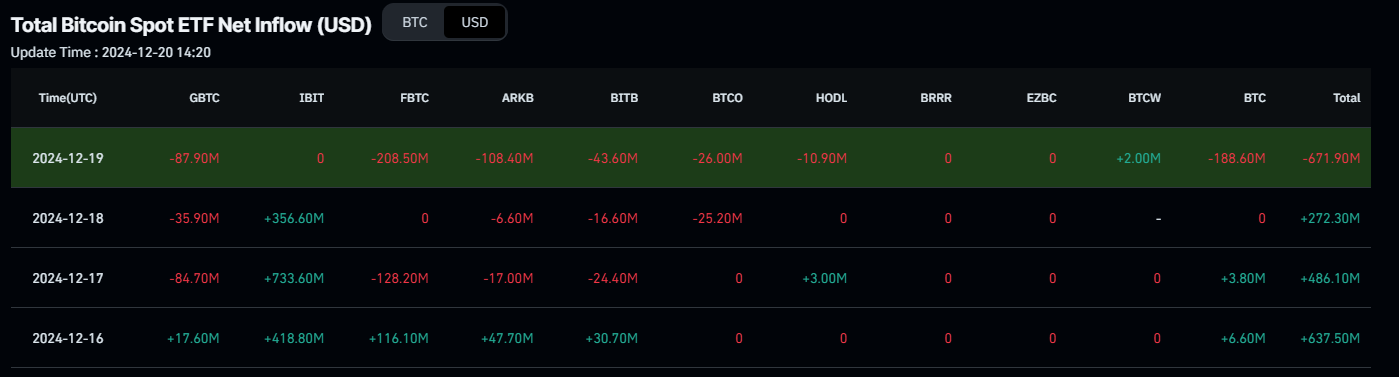
Bitcoin (BTC) price continues to edge down, trading below $95,000 on Friday and on the way towards its worst week since the end of August. This recent price pullback was fueled by the hawkish rate-cut decision by the US Federal Reserve (Fed) on Wednesday, which was followed by the highest single-day outflow ($671.90) from Bitcoin US spot Exchange Traded Funds (ETFs) on Thursday. The technical outlook suggests that the correction is set to continue, targeting the $90,000 level.
How deep will crypto dive?
The crypto market continues to retreat, having lost 4.4% to $3.36 trillion in the last 24 hours and already over 11% from the all-time peak of $3.79 trillion set on Tuesday. While the sell-off in stock markets has slowed, cryptocurrencies are maintaining or even picking up the pace of the decline. This return to early December levels is reminiscent of the rally locking in from November or all the growth of 2024. In the former case, the sell-off could pause in the $3.2 trillion area (-5% from current levels), while in the latter case, the sell-off could pause in the territory below $3 trillion with potential above 12.5%. Despite the threat of a deeper correction, we remain positive on the outlook for the year ahead.
Information on these pages contains forward-looking statements that involve risks and uncertainties. Markets and instruments profiled on this page are for informational purposes only and should not in any way come across as a recommendation to buy or sell in these assets. You should do your own thorough research before making any investment decisions. FXStreet does not in any way guarantee that this information is free from mistakes, errors, or material misstatements. It also does not guarantee that this information is of a timely nature. Investing in Open Markets involves a great deal of risk, including the loss of all or a portion of your investment, as well as emotional distress. All risks, losses and costs associated with investing, including total loss of principal, are your responsibility. The views and opinions expressed in this article are those of the authors and do not necessarily reflect the official policy or position of FXStreet nor its advertisers. The author will not be held responsible for information that is found at the end of links posted on this page.
If not otherwise explicitly mentioned in the body of the article, at the time of writing, the author has no position in any stock mentioned in this article and no business relationship with any company mentioned. The author has not received compensation for writing this article, other than from FXStreet.
FXStreet and the author do not provide personalized recommendations. The author makes no representations as to the accuracy, completeness, or suitability of this information. FXStreet and the author will not be liable for any errors, omissions or any losses, injuries or damages arising from this information and its display or use. Errors and omissions excepted.
The author and FXStreet are not registered investment advisors and nothing in this article is intended to be investment advice.
Recommended Content
Editors’ Picks

PEPE Price Forecast: PEPE could rally to double digits if it breaks above its key resistance level
Pepe (PEPE) memecoin approaches its descending trendline, trading around $0.000007 on Tuesday; a breakout indicates a bullish move ahead.

Tron Price Prediction: Tether’s $1B move triggers TRX ahead of US Congress stablecoin bill review on Wednesday
Tron price defied the broader crypto market downtrend, surging 3% to $0.25 on Monday. This bullish momentum comes as stablecoin issuer Tether minted another $1 billion worth of USDT on the Tron network, according to on-chain data from Arkham.

Ethereum Price Forecast: Short-term holders spark $400 million in realized losses, staking flows surge
Ethereum (ETH) bounced off the $1,800 support on Monday following increased selling pressure from short-term holders (STHs) and tensions surrounding President Donald Trump's reciprocal tariff kick-off on April 2.

BlackRock CEO warns Bitcoin could replace US Dollar as global reserve currency, crypto ETFs witness inflows
BlackRock CEO Larry Fink stated in an annual letter to investors on Monday that the US national debt could cause the Dollar's global reserve status to be replaced with Bitcoin if investors begin to see the digital currency as a safer asset.

Bitcoin: BTC remains calm before a storm
Bitcoin's price has been consolidating between $85,000 and $88,000 this week. A K33 report explains how the markets are relatively calm and shaping up for volatility as traders absorb the tariff announcements. PlanB’s S2F model shows that Bitcoin looks extremely undervalued compared to Gold and the housing market.

The Best brokers to trade EUR/USD
SPONSORED Discover the top brokers for trading EUR/USD in 2025. Our list features brokers with competitive spreads, fast execution, and powerful platforms. Whether you're a beginner or an expert, find the right partner to navigate the dynamic Forex market.