- Both technical and on-chain indicators support the CRO/USD bullish outlook.
- A reversal could invalidate the bullish scenario if support at $0.12 fails to hold.
Crypto.com has gone through a gruesome week following the rejection at the 50 Simple Moving Average, as discussed. The declines were unstoppable at various levels, including $0.14 and $0.12. Fortunately, the buyer congestion at $0.1 appears strong enough to set CRO on a recovery path.
Crypto.com launches new Super App Menu
As CRO price plunged, the Crypto.com team focused on development, with the latest upgrade on the platform’s Super App Menu. The redesigned menu now gives users the ability to navigate the app with ease. Some of the upgrade features include a list view of available assets, shortcuts that provide quick access to services such as Card-Top-Up and recurring purchasing.
Cryrpto.com resumes the uptrend
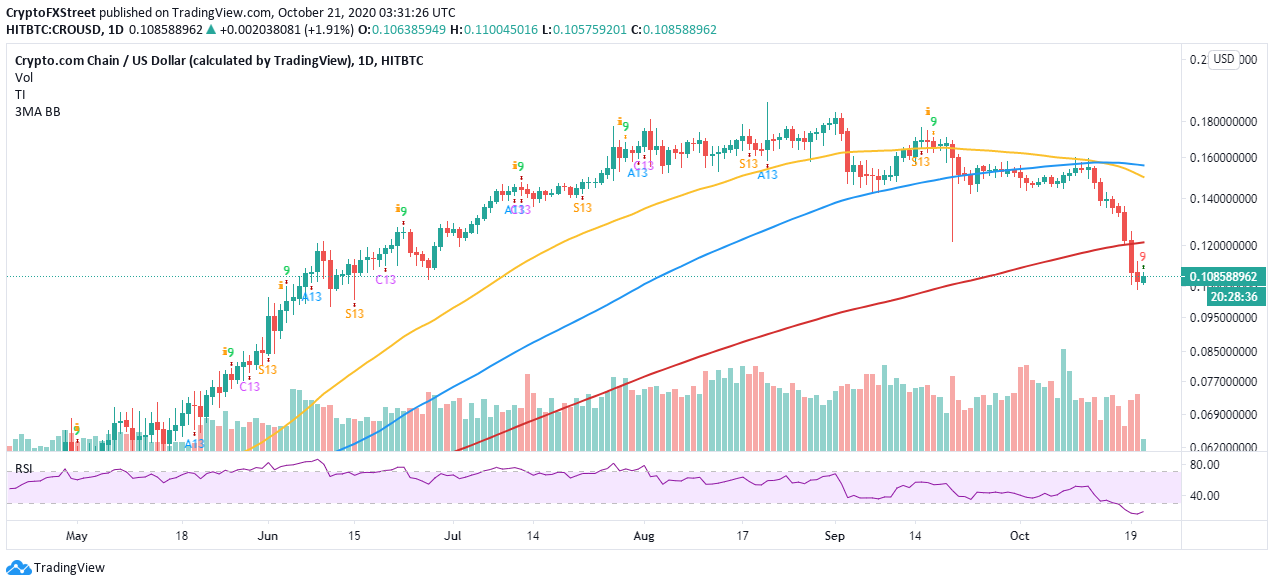
As earlier mentioned, CRO embraced support at $0.1. Buyers seem to be rushing back to take their positions after a life-threatening battering from the bears. CRO/USD is trading at $0.108 amid a bullish building momentum.
The Relative Strength Index (RSI) also shines a light on the bullish outlook after changing direction upwards. Oversold conditions present buying opportunities as they signal the possibility of a reversal. Therefore, it is probable that Crypto.com will continue to gain momentum in the short term as buy orders increase.
A sell signal presented by the TD Sequential indicator in the form of red nine candlestick on the daily chart gives credence to the bullish case. It could also mean that CRO has bottomed out and it’s time to buy the dip.
Resistance at the 200 Simple Moving Average (SMA) is likely to absorb some buying pressure. However, if the hurdle is pushed into the rearview, Crypto.com could quickly rally to $0.16.
CRO/USD 4-hour chart
IntoTheBlock’s IOMAP reveals the absence of resistance ahead of CRO. Thus, if the subtle selling pressure between $0.107 and $0.11 is overcome, the rest of the journey to $0.12 will be relatively smooth. Previously, 778 addresses purchased about 10 million CRO.
On the flip side, Crypto.com is sitting on an area with immense support. The demand in the range between $0.1 and $0.103 hails from the 84 addresses that previously bought roughly 2.7 billion CRO. It is unlikely for Crypto.com to penetrate this zone, especially with buyers slowly returning to the market.
Crypto.com IOMAP model
Looking at the other side of the fence
It is worth mentioning that the buy signal will be invalidated if support at $0.12 fails to hold. In other words, crypto.com is not entirely out of the woods yet. Moreover, the resistance presented by the IOMAP between $0.1 and $0.103 might delay the breakout even resume the downtrend to $0.057 as discussed before.
Information on these pages contains forward-looking statements that involve risks and uncertainties. Markets and instruments profiled on this page are for informational purposes only and should not in any way come across as a recommendation to buy or sell in these assets. You should do your own thorough research before making any investment decisions. FXStreet does not in any way guarantee that this information is free from mistakes, errors, or material misstatements. It also does not guarantee that this information is of a timely nature. Investing in Open Markets involves a great deal of risk, including the loss of all or a portion of your investment, as well as emotional distress. All risks, losses and costs associated with investing, including total loss of principal, are your responsibility. The views and opinions expressed in this article are those of the authors and do not necessarily reflect the official policy or position of FXStreet nor its advertisers. The author will not be held responsible for information that is found at the end of links posted on this page.
If not otherwise explicitly mentioned in the body of the article, at the time of writing, the author has no position in any stock mentioned in this article and no business relationship with any company mentioned. The author has not received compensation for writing this article, other than from FXStreet.
FXStreet and the author do not provide personalized recommendations. The author makes no representations as to the accuracy, completeness, or suitability of this information. FXStreet and the author will not be liable for any errors, omissions or any losses, injuries or damages arising from this information and its display or use. Errors and omissions excepted.
The author and FXStreet are not registered investment advisors and nothing in this article is intended to be investment advice.
Recommended Content
Editors’ Picks
Ripple on-chain metrics show bullish signs amidst legal struggle with SEC, XRP eyes recovery
![Ripple on-chain metrics show bullish signs amidst legal struggle with SEC, XRP eyes recovery](https://editorial.fxstreet.com/images/Markets/Currencies/Cryptocurrencies/Coins/Ripple/Ripple_Coin_31_02_XtraSmall.jpg)
Ripple made a comeback above $0.48 on Tuesday and hovers above that level in Wednesday’s European session. Ripple on-chain metrics such as transaction volume and Network Realized Profit/Loss have turned bullish, supporting a recovery in the altcoin.
Bitcoin price falls amidst German government transfers, miners activity
![Bitcoin price falls amidst German government transfers, miners activity](https://editorial.fxstreet.com/images/Markets/Currencies/Digital%20Currencies/Bitcoin/bit-coin-symbol-flag-3d-illustration-59931110_XtraSmall.jpg)
Bitcoin (BTC) extends correction on Wednesday and hovers around $61,000 after finding resistance near the $64,000 level on Monday. Recent on-chain data indicates heightened selling activity from Bitcoin miners early in the week.
Crypto Today: Bitcoin erases gains from end of June, Ethereum declines while Ripple holds
![Crypto Today: Bitcoin erases gains from end of June, Ethereum declines while Ripple holds](https://editorial.fxstreet.com/images/Markets/Currencies/Digital%20Currencies/Bitcoin/Bitcoin_2_XtraSmall.jpg)
Bitcoin wipes out gains from the last week of June and falls below $60,000 on Wednesday. Ethereum and top altcoins ranked by market capitalization erased gains as the inflation outlook worsened. Ripple holds on to recent gains and hovers above $0.48 on Wednesday.
Three reasons why altcoins could shake off losses this week
![Three reasons why altcoins could shake off losses this week](https://editorial.fxstreet.com/images/Markets/Currencies/Cryptocurrencies/cryptos_XtraSmall.jpg)
On-chain data from Santiment shows that altcoins are currently in the opportunity zone, or generating buy signals. The top three altcoins in the buy zone are Basic Attention Token (BAT), Chromia (CHR), and Highstreet (HIGH), per Santiment.
Bitcoin: BTC price correction could end in July, according to seasonal data
![Bitcoin: BTC price correction could end in July, according to seasonal data](https://editorial.fxstreet.com/images/Markets/Currencies/Digital%20Currencies/Bitcoin/bitcoin_5_XtraSmall.jpg)
Bitcoin (BTC) price appears poised for a decline this week, influenced by slight outflows in US spot ETFs, selling activity among BTC miners, and a combined transfer of 4,690.28 BTC to centralized exchanges by the US and German governments.