What does Altcoin season have in store for LINK, ZAP and ADA?
Original content: What does Altcoin season have in store for LINK, ZAP and ADA?
Signs that an Altcoin season is around the corner are beginning to emerge across the cryptocurrency market. ''Alt season'', where most altcoins break out in their BTC and USD pairings, usually comes off the back of a major run-up in the price of BTC and the price then subsequently stalling or pulling back.
Now that Bitcoin has reached a fresh all-time high and looks set to hit $100,00 by the end of the year, analysts are forecasting Alt season to really kick off later in Q4 and in the first quarter of 2022.
ZAP/USD to edge higher as profit flows into Altcoins
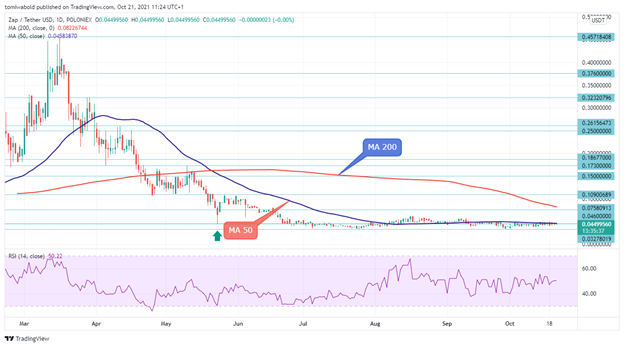
ZAP/USD Daily Chart
ZAP fell against the US dollar in the first half of September. However, by the end of the month, the pair had recovered all of its lost ground. Overall sentiment remains upbeat and a close above $0.0460 may trigger a rally to $0.0758 and extend the token’s recovery towards $0.0822.
The moving average (MA 200) at $0.0822 will be a viable objective for ZAP/USD. It is rebounding with a wave of bullish action from the Alt season. However, the resistance level of $0.0758 may create resistance for the rate this session and the next.
ZAP's near-term bias remains with bulls, but a firm break of $0.0460 is needed to confirm the reversal signal on the daily chart.
Looking at the longer term, given ZAP’s strong use case – and just how well other DeFi tokens have performed – it’s difficult not to be extremely bullish on this token, especially with it currently trading below $0.05.
LINK/USD stands above flat MAs, neutral overall
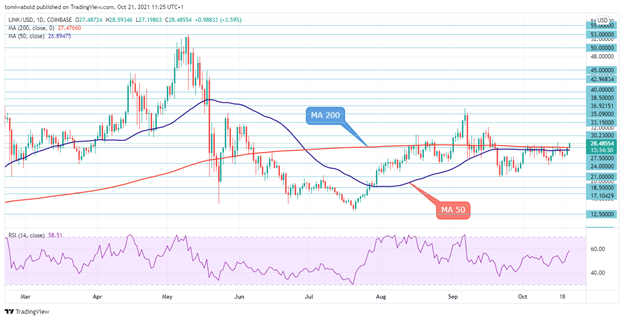
LINK/USD Daily Chart
Chainlink (LINK) continues to be range-bound, something also reflected in the flattening out of the slopes of the moving averages 50 and 200. The technical indicators confirm the neutral bias as the RSI is hovering above the 50 levels.
The pair may strengthen its positive momentum above the current high at $28.57. The next resistance level above the $32.12 level could come around the $36.35 mark, acting as the upper range of the recent consolidation zone.
Above this level, the targets could be within the $44.37-$52.99 levels (the token’s all-time high). However, if prices are unable to break above the range, the risk would shift back to the downside, with the MA 50 and 200 at $26.89 and $27.47 respectively coming into focus. Even lower, the next support to watch could be detected near $23.53 and $20.81. Failure to hold above these boundaries could result in the bears gaining the advantage.
ADA/USD consolidates, limited between the moving averages
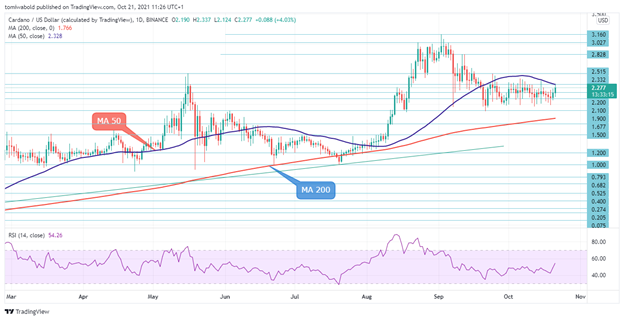
ADA/USD Daily Chart
Cardano (ADA) is currently creeping sideways, constricted between the 50 and 200 moving averages after the pullback from its September all-time highs of $3.16. The RSI is crawling up from the 50 neutral levels. In a positive scenario, immediate resistance may originate from the MA 50 at the $2.32 barrier.
Overrunning this, and the $2.50 level, the ADA/USD pair may hit the $2.82 high before challenging the $3 psychological level. Otherwise, a price decline may face an enhanced obstructing zone from $1.89 to $1.76, which also contains the MA 200.
Conclusion
As Bitcoin continues to rally, a large number of traders and investors are expected to take profit and reinvest them in altcoins, as they are perceived to offer higher returns than BTC, especially once it breaches $100,000.
ZAP looks well poised to benefit from this flow of BTC profit to altcoins, as its fundamentals look very strong and the token remains seriously undervalued by almost every metric.
ADA and LINK are two other tokens which will also attract their fair share of interest in the upcoming Altcoin season, though in the short term, technical analysis suggests they will trade relatively flat, particularly when compared to Bitcoin’s ongoing rally.
BEST BROKERS TO TRADE CRYPTO
The information has been prepared for information purposes only. The document is not intended as personalized investment advice and does not constitute a recommendation to buy, sell or hold investments described herein. This information contained herein is derived from sources we believe to be reliable, but of which we have not independently verified. FXInstructor LLC assumes no responsibilities for errors, inaccuracies or omissions in these materials, nor shall it be liable for damages arising out of any person's reliance upon this information. FXInstructor LLC does not warrant the accuracy or completeness of the information, text, graphics, links or other items contained within these materials. FXInstructor LLC shall not be liable for any indirect, incidental, or consequential damages including without limitation losses, lost revenues or lost profits that may result from these materials. Opinions and estimates constitute our judgment and are subject to change without notice. Past performance is not indicative of future results


