- COTI price breaks above a descending wedge pattern, signaling a change in market structure from bearish to bullish.
- COTI announces its participation in the Central Bank of Israel for its CBDC project.
- On-chain data shows COTI's capitulation events occurred on Friday and Sunday.
- A daily candlestick close below $0.066 would invalidate the bullish thesis.
COTI (COTI) price retraces by 1.2% at $0.1125 at the time of writing on Wednesday after breaking above a descending wedge pattern last Friday, leading to an 8% rally over the subsequent four days. The announcement of COTI's participation in the Central Bank of Israel's CBDC project coincided with capitulation events on Friday and Sunday, as indicated by on-chain data, suggesting the possibility of a price rally for COTI in the near future.
COTI announces its participation in the Central Bank of Israel's CBDC project alongside PayPal and Fireblocks
On Tuesday, COTI announced on Twitter that it will participate in the Central Bank of Israel's CBDC project alongside companies like PayPal and Fireblocks.
COTI views CBDCs as a significant application for its forthcoming privacy-focused infrastructure and is excited to announce this achievement. The Bank of Israel has been exploring CBDCs since 2018 and will now explore with COTI the implementation and use of advanced functionalities and ways to build an ecosystem around its CBDC.
"As the only blockchain network selected to take part, COTI's privacy-focused L2 blockchain offers advanced features to hold and securely transact with CBDCs", COTI tweeted.
COTI's expertise in blockchain technology and selection as the only blockchain network to participate in the project alongside giants like PayPal and Fireblocks showcases its credibility and potential for growth.
Additionally, COTI's privacy-focused L2 blockchain offers advanced features for securely transacting with CBDCs, making it well-positioned to meet the growing demand for credible and scalable blockchain infrastructure in the CBDC marketplace. This milestone solidifies COTI's reputation and potential for future success in the crypto and finance areas.
COTI will take part in the Central Bank of Israel's #CBDC project alongside giants like @PayPal and @FireblocksHQ
— COTI Foundation (@COTInetwork) July 23, 2024
This is a major milestone for COTI as it positions itself as a leader in the CBDC market!
Read more: https://t.co/OQrQ5YKqtt
1/3 pic.twitter.com/5YFxqJ595D
COTI price sets for a rally
COTI’s price broke out of the falling wedge pattern on Friday, leading to an 8% rally over the subsequent four days. This pattern was formed by joining multiple highs and lows with trendlines from mid-March to late July, and this breakout suggests a bullish move. As of Wednesday, it retraces and trades slightly down 1.2% at $0.1125.
If COTI continues to retrace, it could find support at the breakout level at $0.0989, coinciding closely with the 50-day Exponential Moving Average (EMA) at $0.1015. This would establish a critical zone of support that should be monitored closely.
If this support area at $0.0989 holds, COTI could rally 49% to retest its daily resistance at $0.1477.
On the daily chart, the Relative Strength Index (RSI) and the Awesome Oscillator (AO) indicators are trading above their neutral levels of 50 and zero, respectively. This robust momentum signals a strong bullish sentiment in the market.
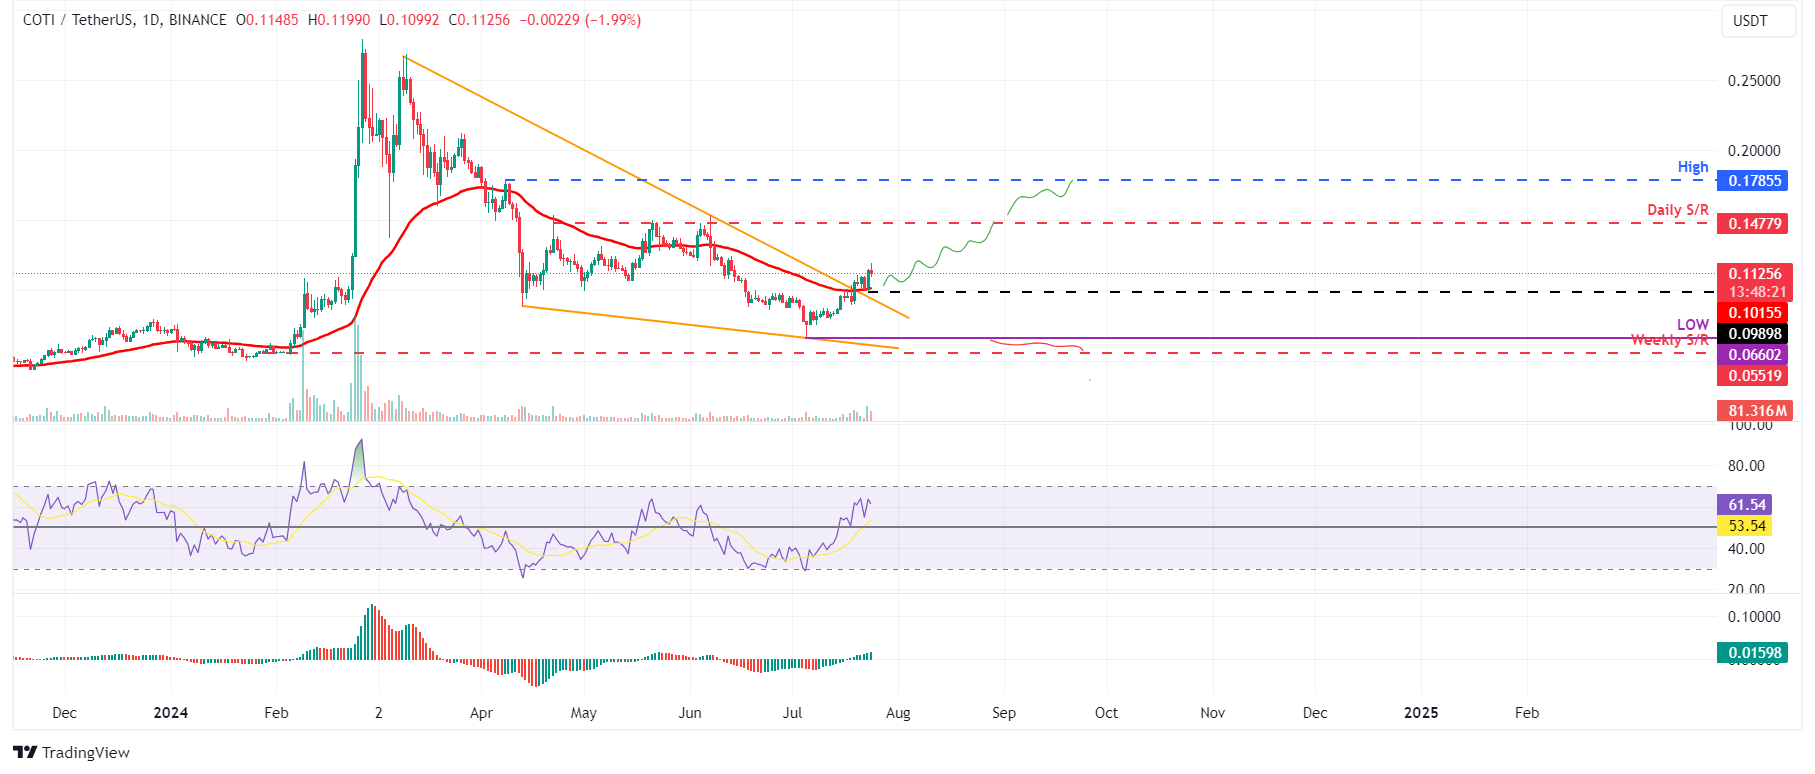
COTI/USDT daily chart
On-chain data provider Santiment's Network Realized Profit/Loss (NPL) indicator computes a daily network-level Return On Investment (ROI) based on the coin's on-chain transaction volume. Simply put, it is used to measure market pain. Strong spikes in a coin's NPL indicate that its holders are, on average, selling their bags at a significant profit. On the other hand, strong dips imply that the coin's holders are, on average, realizing losses, suggesting panic sell-offs and investor capitulation.
In COTI's case, the NPL indicator dipped from -319,060 to -1.7 million from July 18 to July 19 and from 64,244 to -862,320 from July 20 to July 21, respectively. This negative downtick indicates that the holders were, on average, realizing losses.
During this capitulation event, COTI's supply on exchanges declined from 121.64 million to 111.53 million in four days. This decrease in supply on exchanges indicates that investors are moving COTI tokens to wallets and reducing selling activity, signaling a bullish outlook and further denoting investor confidence in COTI.
%20[15.31.14,%2024%20Jul,%202024]-638574200291266933.png)
COTI Network Realized Profit/Loss and Supply on Exchanges chart
Even though on-chain metrics and technical analysis point to a bullish outlook, if COTI's price makes a daily candlestick close below $0.0660, the bullish thesis would be invalidated by creating a lower low on the daily chart. This development could see COTI's price decline by 17% to retest its weekly support at the $0.0551 level.
Information on these pages contains forward-looking statements that involve risks and uncertainties. Markets and instruments profiled on this page are for informational purposes only and should not in any way come across as a recommendation to buy or sell in these assets. You should do your own thorough research before making any investment decisions. FXStreet does not in any way guarantee that this information is free from mistakes, errors, or material misstatements. It also does not guarantee that this information is of a timely nature. Investing in Open Markets involves a great deal of risk, including the loss of all or a portion of your investment, as well as emotional distress. All risks, losses and costs associated with investing, including total loss of principal, are your responsibility. The views and opinions expressed in this article are those of the authors and do not necessarily reflect the official policy or position of FXStreet nor its advertisers. The author will not be held responsible for information that is found at the end of links posted on this page.
If not otherwise explicitly mentioned in the body of the article, at the time of writing, the author has no position in any stock mentioned in this article and no business relationship with any company mentioned. The author has not received compensation for writing this article, other than from FXStreet.
FXStreet and the author do not provide personalized recommendations. The author makes no representations as to the accuracy, completeness, or suitability of this information. FXStreet and the author will not be liable for any errors, omissions or any losses, injuries or damages arising from this information and its display or use. Errors and omissions excepted.
The author and FXStreet are not registered investment advisors and nothing in this article is intended to be investment advice.
Recommended Content
Editors’ Picks

Polygon joins forces with WSPN to expand stablecoin adoption
WSPN, a stablecoin infrastructure company based in Singapore, has teamed up with Polygon Labs to make its stablecoin, WUSD, more useful in payment and decentralized finance.

Coinbase envisages listing of more meme coins amid regulatory optimism
Donald Trump's expected return to the White House creates excitement in the cryptocurrency sector, especially at Coinbase, the largest US-based crypto exchange. The platform is optimistic that the new administration will focus on regulatory clarity, which could lead to more token listings, including popular meme coins.

Cardano's ADA leaps to 2.5-year high of 90 cents as whale holdings exceed $12B
As Bitcoin (BTC) gets closer to the $100,000 mark for the first time — it crossed $99,000 earlier Friday — capital is rotating into alternative cryptocurrencies, creating a buzz in the broader crypto market.
Shiba Inu holders withdraw 1.67 trillion SHIB tokens from exchange
Shiba Inu trades slightly higher, around $0.000024, on Thursday after declining more than 5% the previous week. SHIB’s on-chain metrics project a bullish outlook as holders accumulate recent dips, and dormant wallets are on the move, all pointing to a recovery in the cards.

Bitcoin: Rally expected to continue as BTC nears $100K
Bitcoin (BTC) reached a new all-time high of $99,419, just inches away from the $100K milestone and has rallied over 9% so far this week. This bullish momentum was supported by the rising Bitcoin spot Exchange Traded Funds (ETF), which accounted for over $2.8 billion inflow until Thursday. BlackRock and Grayscale’s recent launch of the Bitcoin ETF options also fueled the rally this week.

Best Forex Brokers with Low Spreads
VERIFIED Low spreads are crucial for reducing trading costs. Explore top Forex brokers offering competitive spreads and high leverage. Compare options for EUR/USD, GBP/USD, USD/JPY, and Gold.