Cosmos price could slide to $10 as multiple hurdles subdue ATOM bulls
- Cosmos price has been in a downtrend for the last two weeks, falling 25% to trade at $10.89.
- The downtrend could see ATOM find support at $10.55 before a sell signal sends the price lower.
- A daily candlestick close above the midline of the descending channel at $11.55 would threaten the bearish thesis.

Cosmos (ATOM) price has been in a downtrend since February 20, dropping by a significant margin as selling pressure escalated. Investors were booking profits to avoid further losses. The resultant price action flows in tandem with the current general market sentiment defined by different catastrophes, including the recent demise of Silvergate Capital bank.
Silvergate Capital, one of the main banks lending to the crypto industry, said it is shutting down and liquidating. More here: https://t.co/vrJvhRDhpO pic.twitter.com/Sr2SzBPClT
— Reuters Business (@ReutersBiz) March 9, 2023
Cosmos price suffers accumulating overhead pressure
Cosmos price is down 5.65% in the last 24 hours as overhead pressure builds up. ATOM was consolidating within the confines of a descending parallel channel. This technical formation is obtained by connecting three lower highs and three lower lows formed over the last month using trend lines.
Investors should expect the bears to drive ATOM lower within the descending channel. Supporting this bearish outlook is the potential bearish crossover between the 50-day and the 200-day EMAs around $12.65 level. If bears continue to run amok, it will likely trigger the said sell signal, inducing a new wave of bearish momentum.
In such a situation, Cosmos price could descend to tag the immediate support level at $10.55, a breakdown of which could see it retest the subsequent level at $9.32. While this move in total would amount to a 13.61% plummet in ATOM’s market value, an extremely bearish outlook could see the altcoin revisit the December 2022 lows at the $8.47 support floor, bringing the total loss from 13.61% to 21.74%.
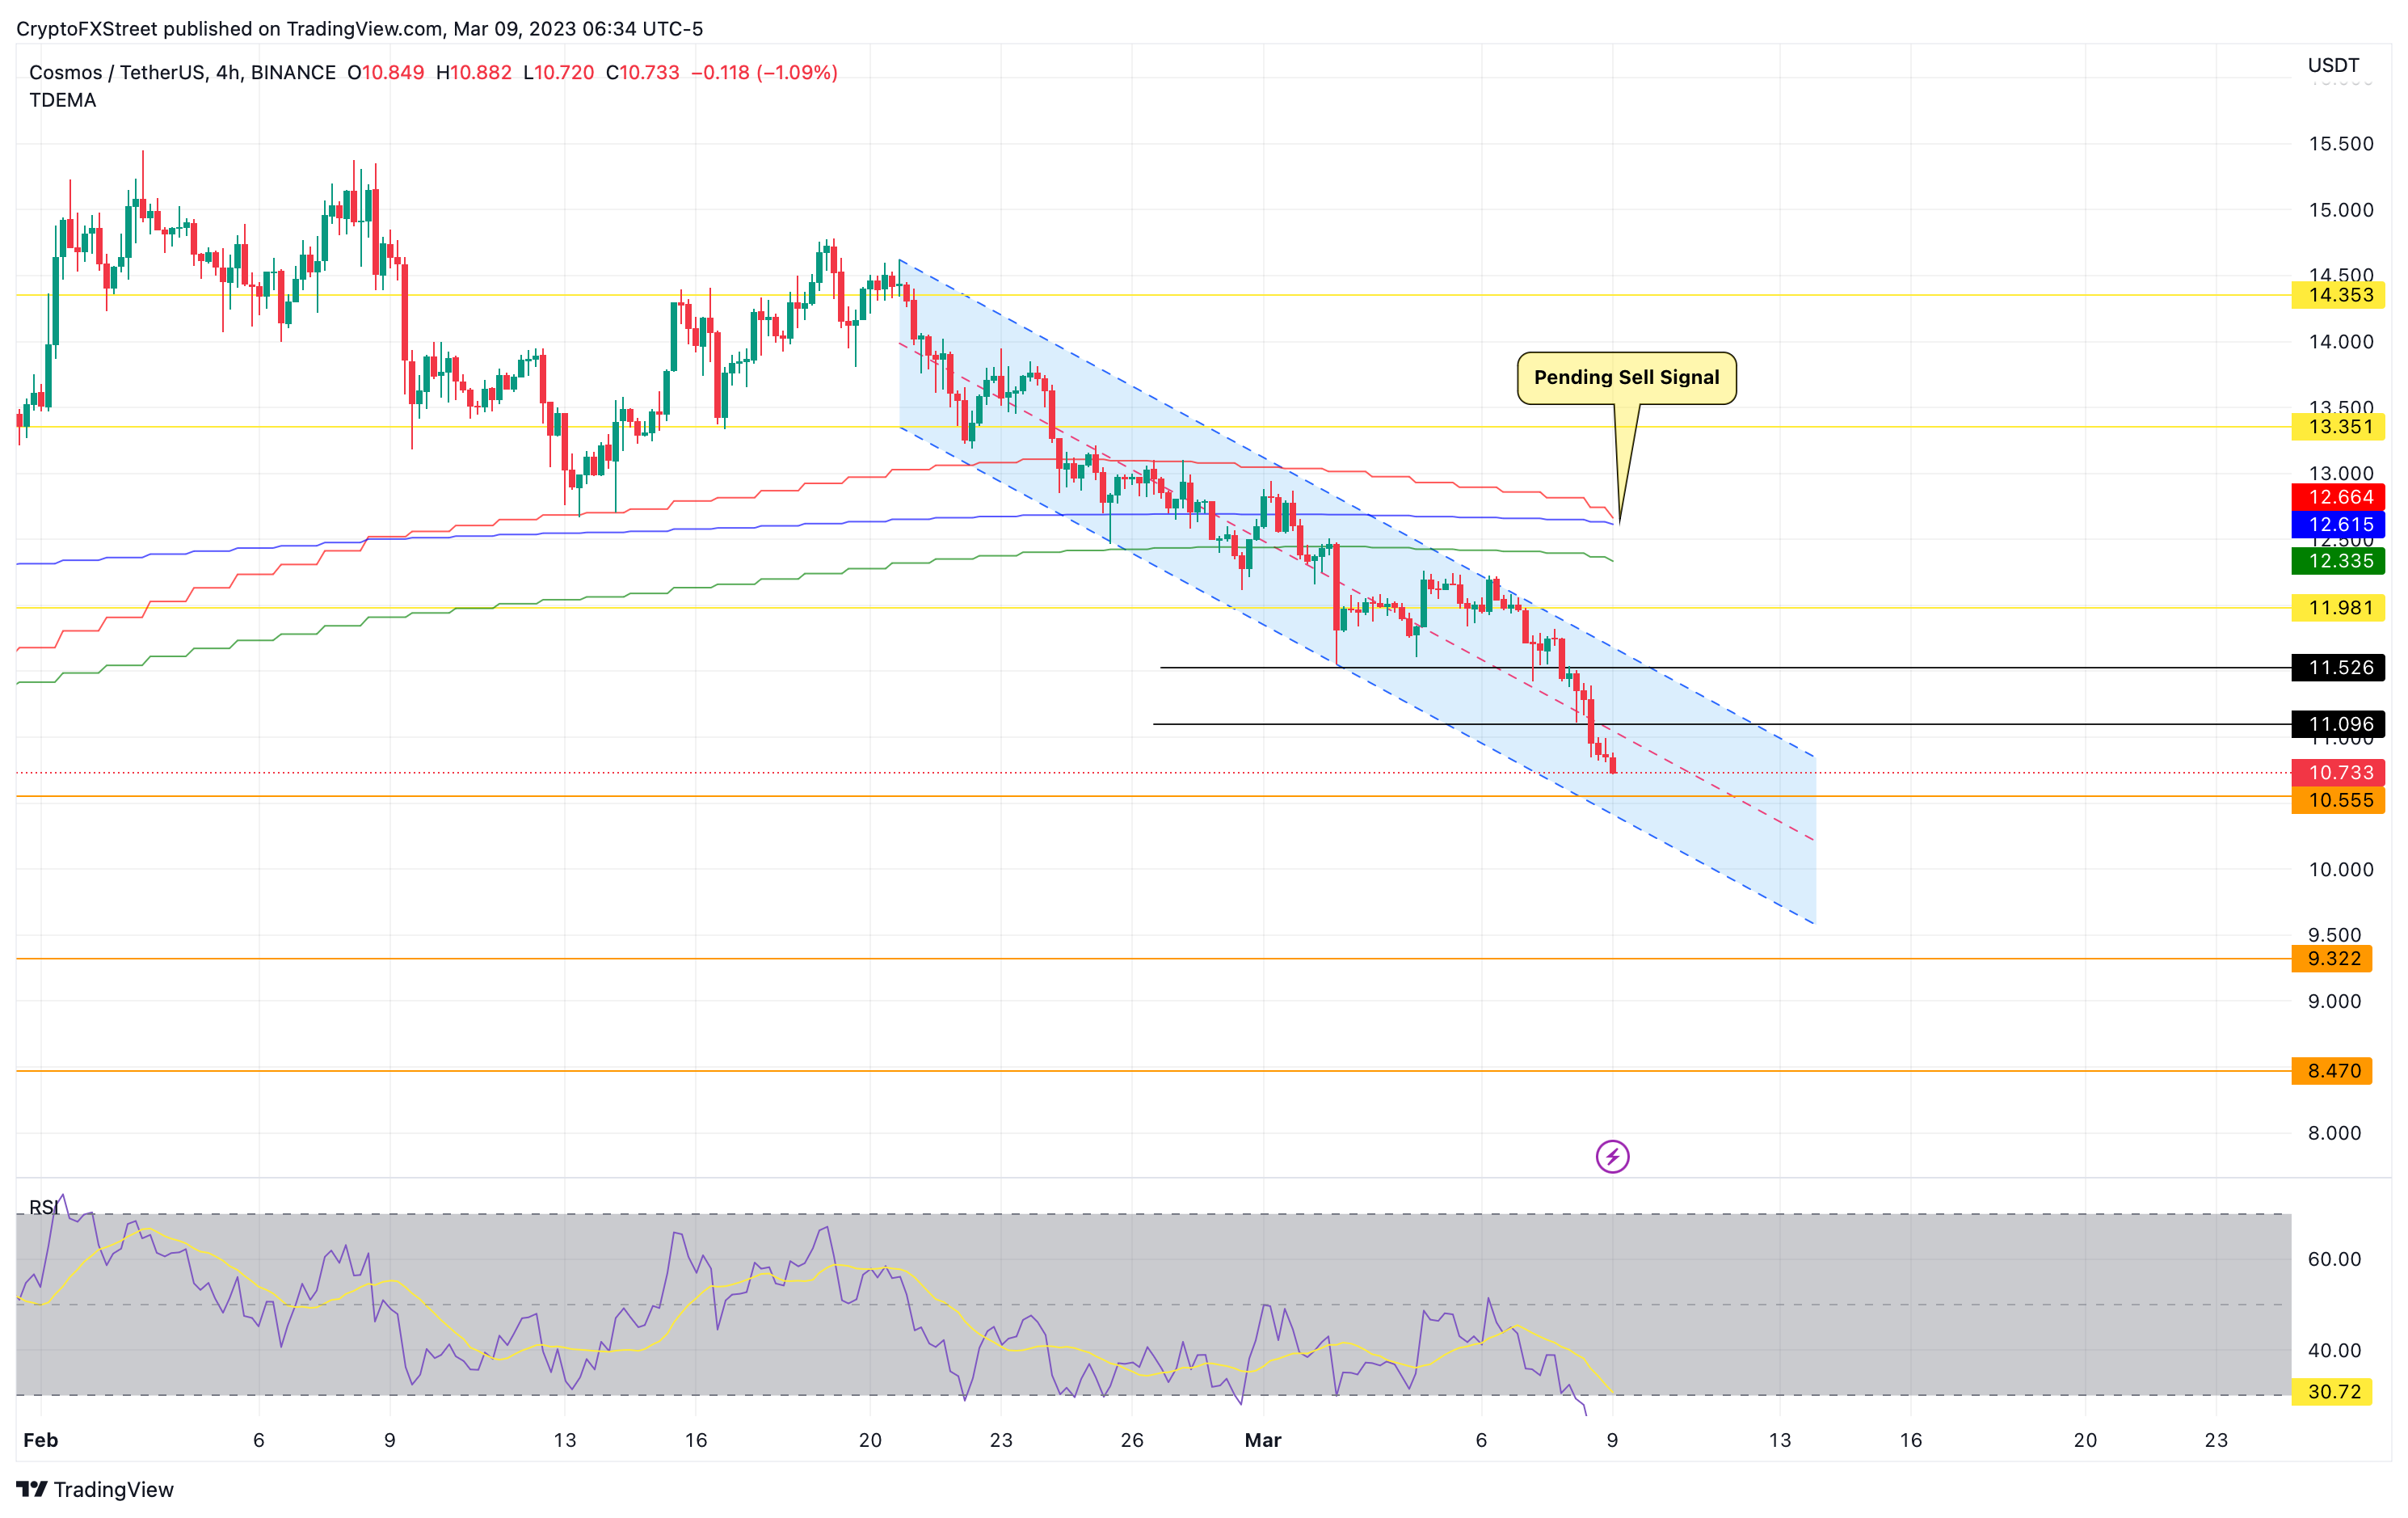
ATOM/USDT 4-hour chart
On the upside, Cosmos price could increase if traders disregard the bearish signal and increase their buying momentum. A daily candlestick close above the midline of the descending channel at $11.09 could increase the odds of recovery.
Only a decisive flip of the $11.52 resistance level into a support floor, however, would invalidate the bearish outlook. In such a case, Cosmos price could attempt a breakout from the descending parallel channel. A successful move could see ATOM grapple with the next roadblock at $11.98.
In highly ambitious cases, Cosmos price could soar as high as the $13.35 resistance level or higher to the $14.35 resistance level. Such a climb would constitute a 32.32% increase from the current levels.
Author

Akash Girimath
FXStreet
Akash Girimath is a Mechanical Engineer interested in the chaos of the financial markets. Trying to make sense of this convoluted yet fascinating space, he switched his engineering job to become a crypto reporter and analyst.


