![]() Lorenzo Stroe
Lorenzo Stroe
Independent Analyst
- Compound price faces a critical barrier at $101, but on-chain metrics suggest it can experience a rally.
- The number of new users joining the Compound network has skyrocketed by 350%.
According to recent statistics provided by Dune Analytics, the total number of Compound users has skyrocketed by 350% in the past month, reaching a total of 175,000 users. It seems that the most significant spike happened on October 16. Compound price could be on the verge of a breakout thanks to the recent interest shown by new users.
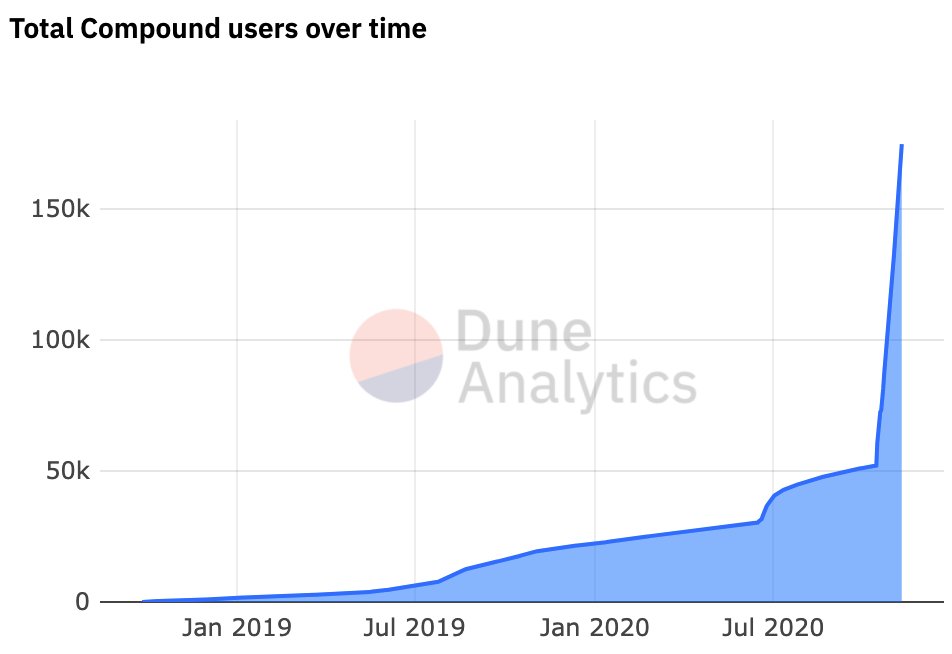
Compound New Users chart
The number of users joining the Compound network has been slowly increasing since July 2019 and had a notable spike in July 2020 as the digital asset hit the market. The most recent colossal rise was unexpected, but a strong bullish indicator that new users are really interested in the digital asset despite its decline in value.
Compound faces one last barrier before a potential run to $120
From a technical view, Compound price formed an equilibrium pattern with a lower high at $101 and a higher low at $96.62 on the 4-hour chart. It seems that COMP broke out of this pattern in the past 24 hours, reaching $102.96 but getting rejected from the 200-SMA.
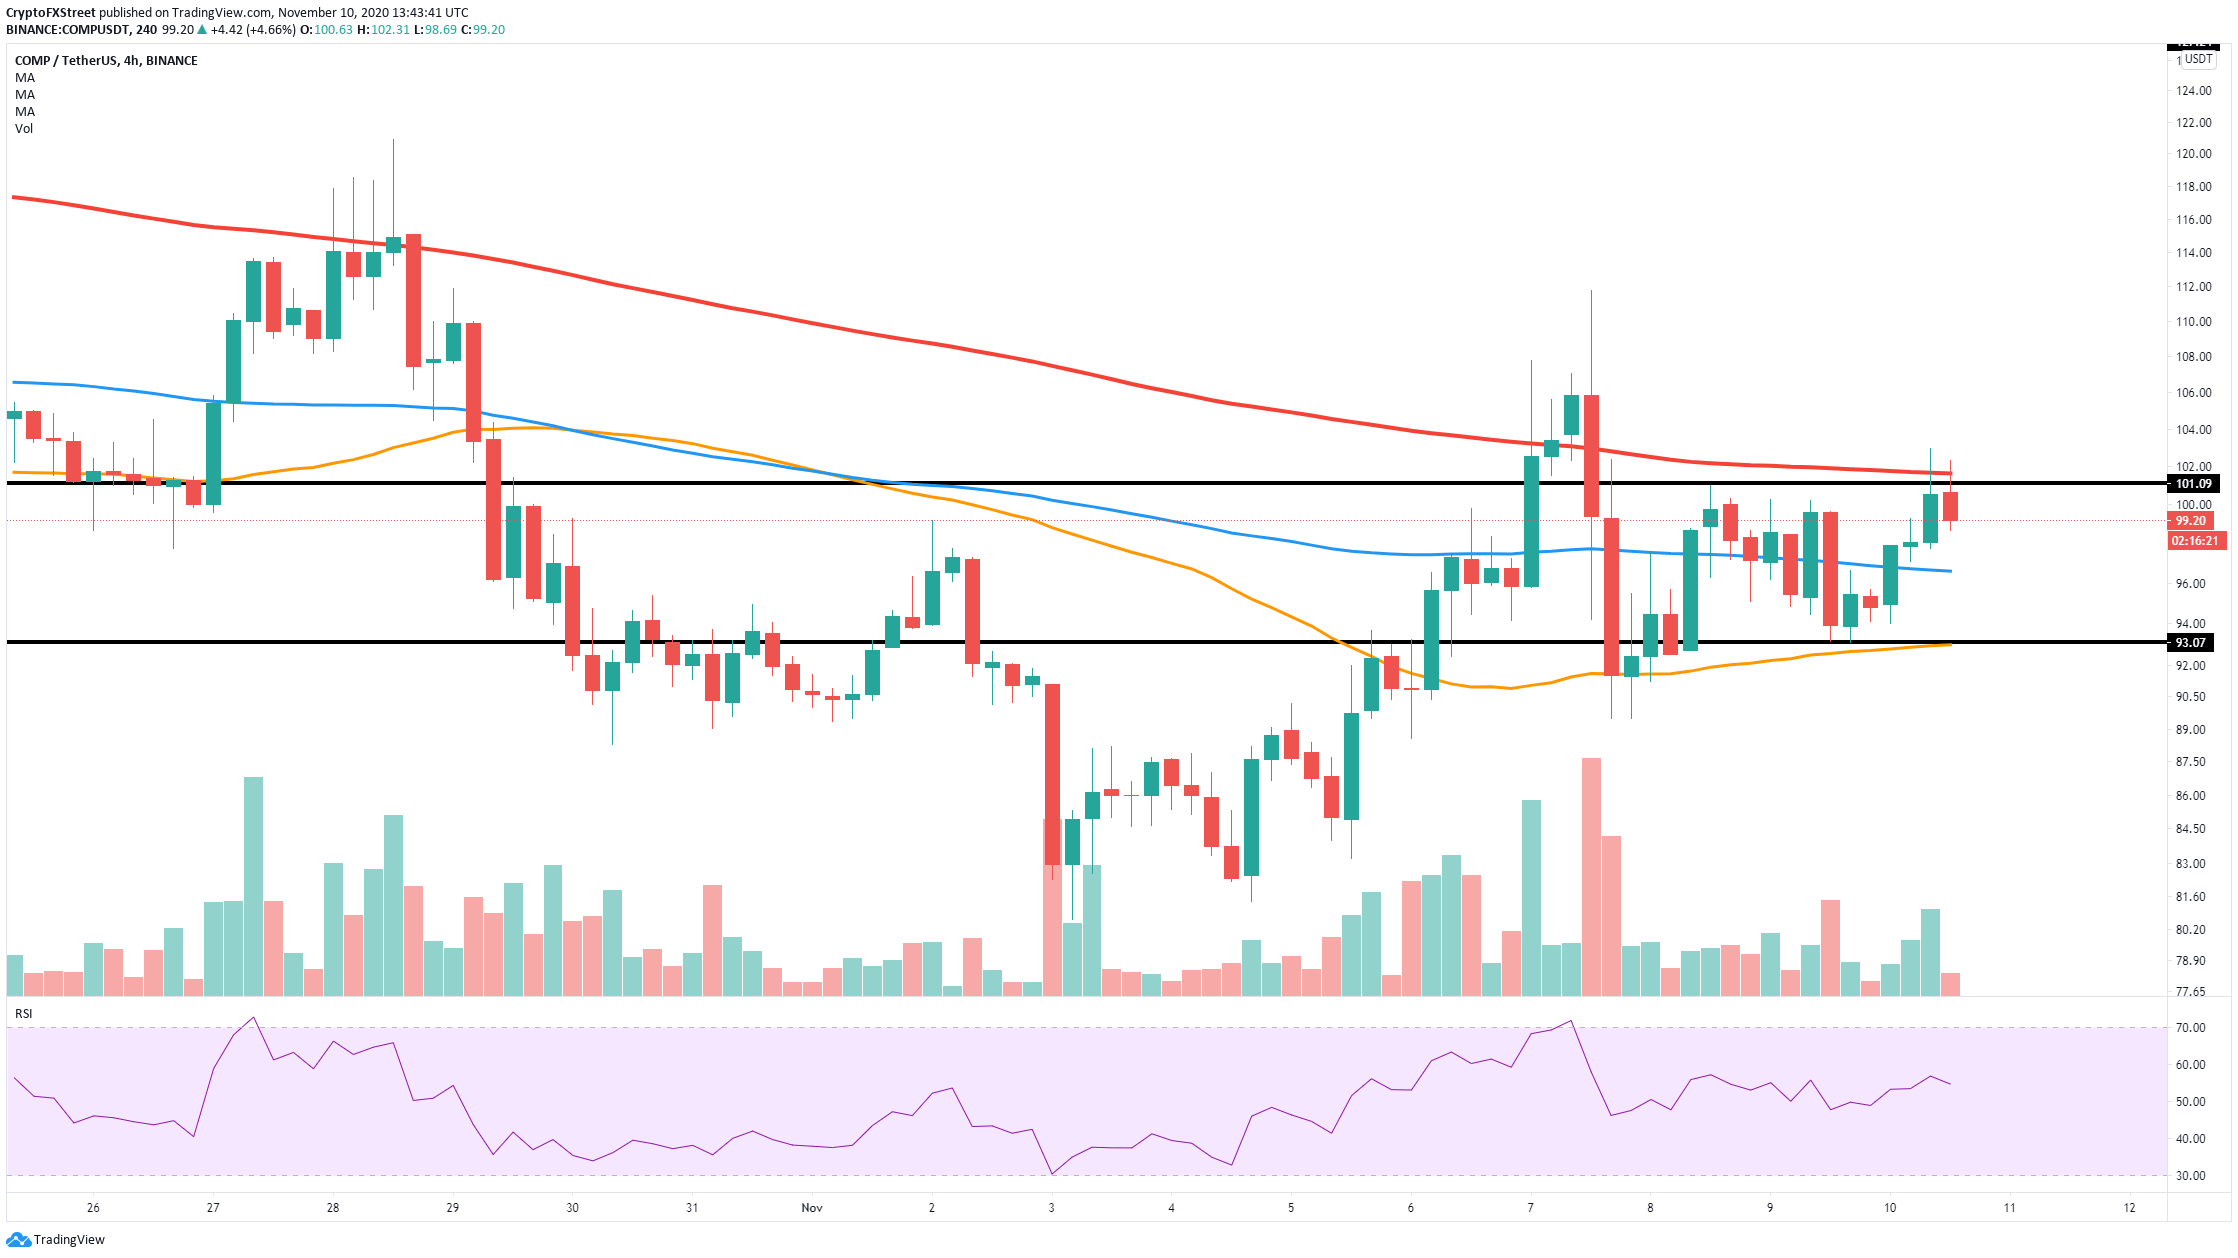
COMP/USD 4-hour chart
The 200-SMA at $102 is now the most critical resistance level in the short-term. A breakout above this point can drive Compound price towards the high of $111.8 and potentially towards $120.
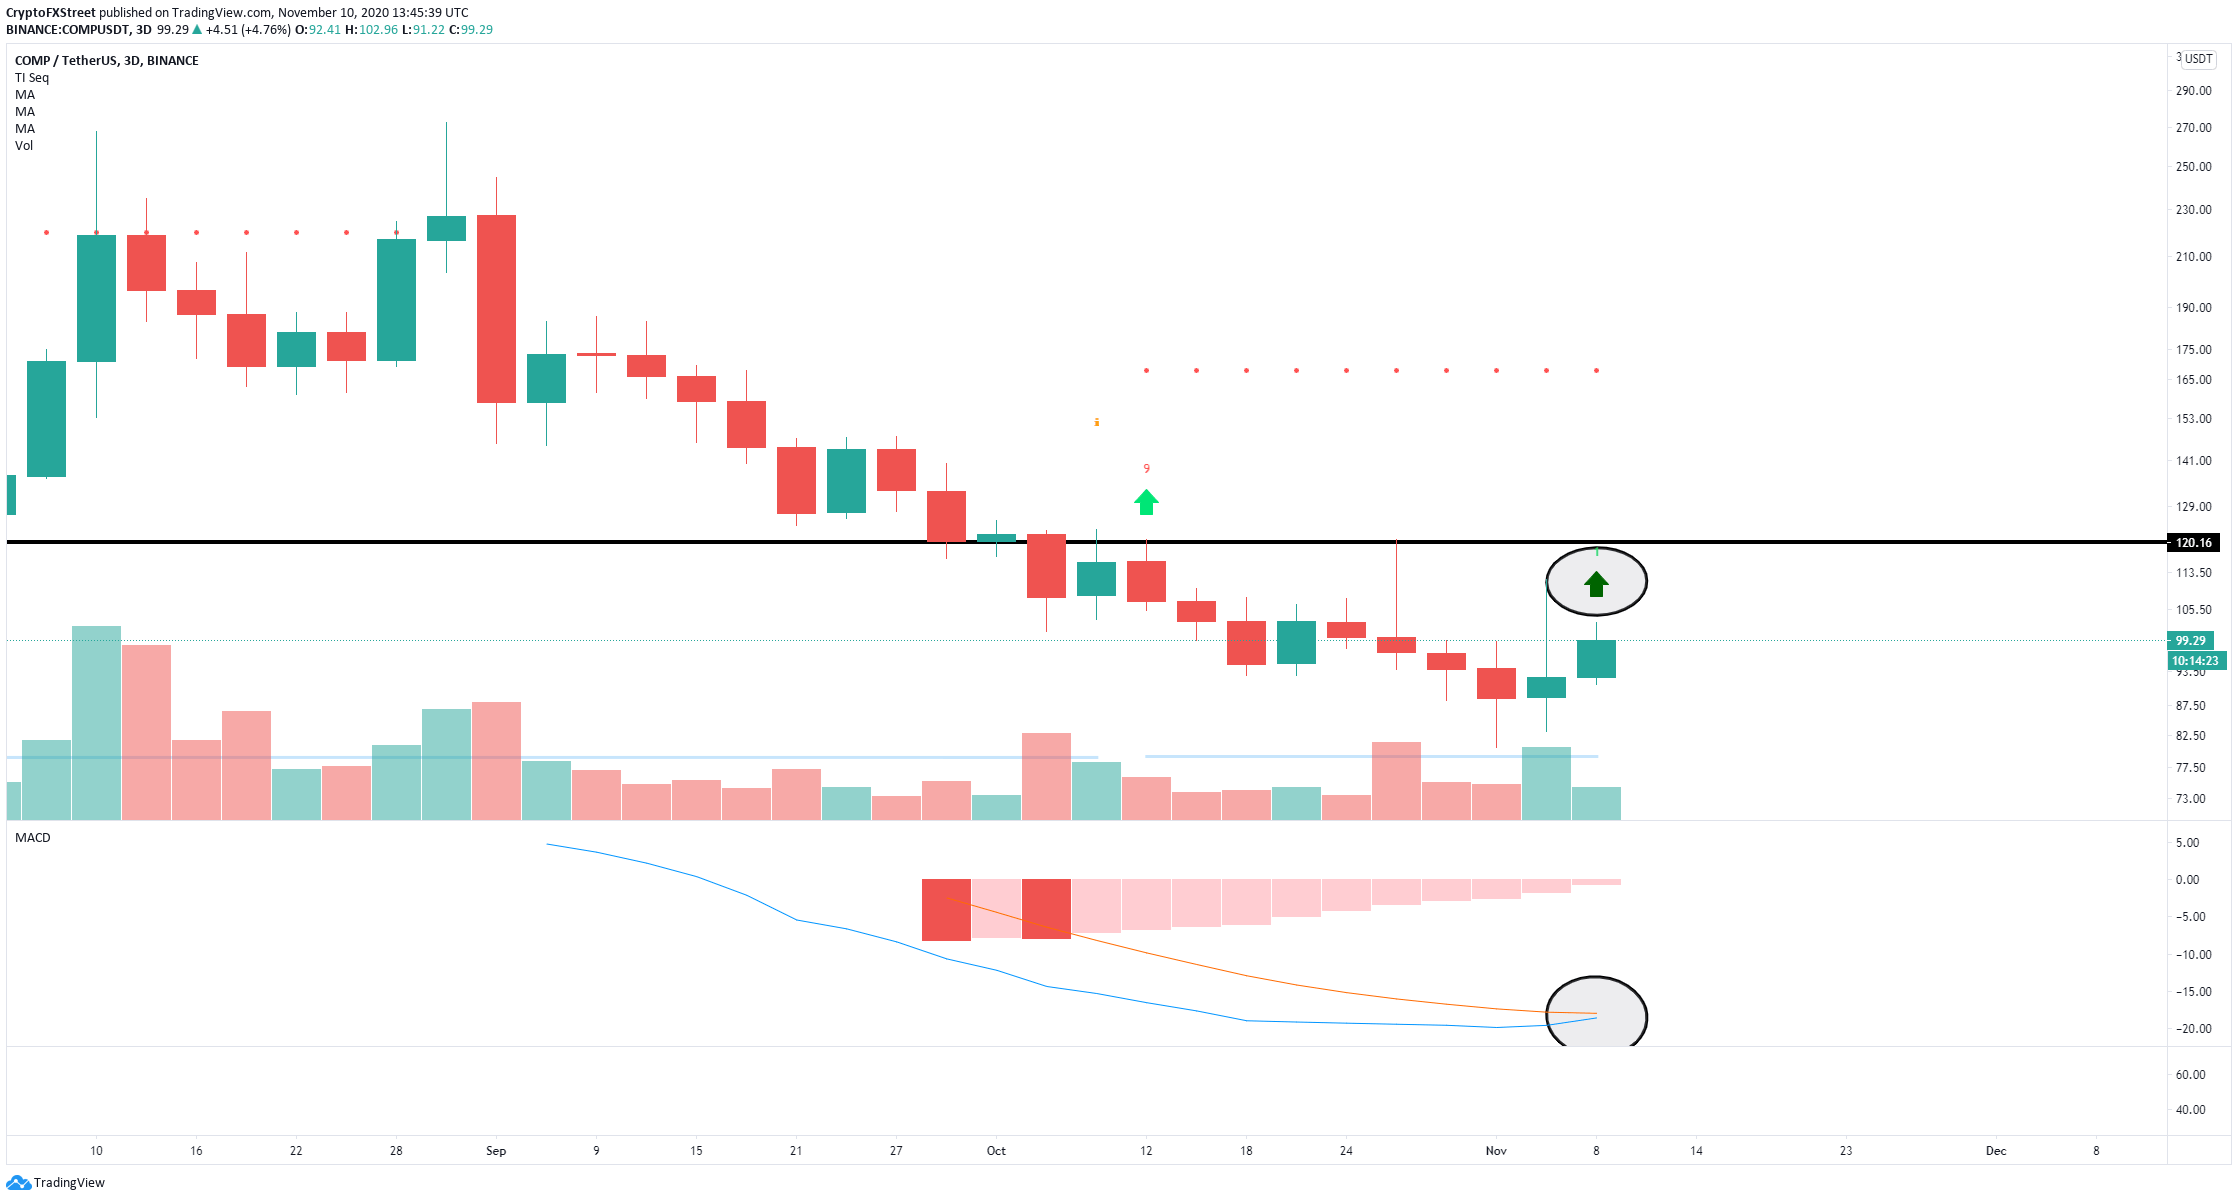
COMP/USD 3-day chart
Additionally, the TD Sequential indicator has presented a buy signal on the 3-day chart as the MACD is on the verge of a bullish cross for the first time ever. The price target on the 3-day chart seems to be the same at $120.
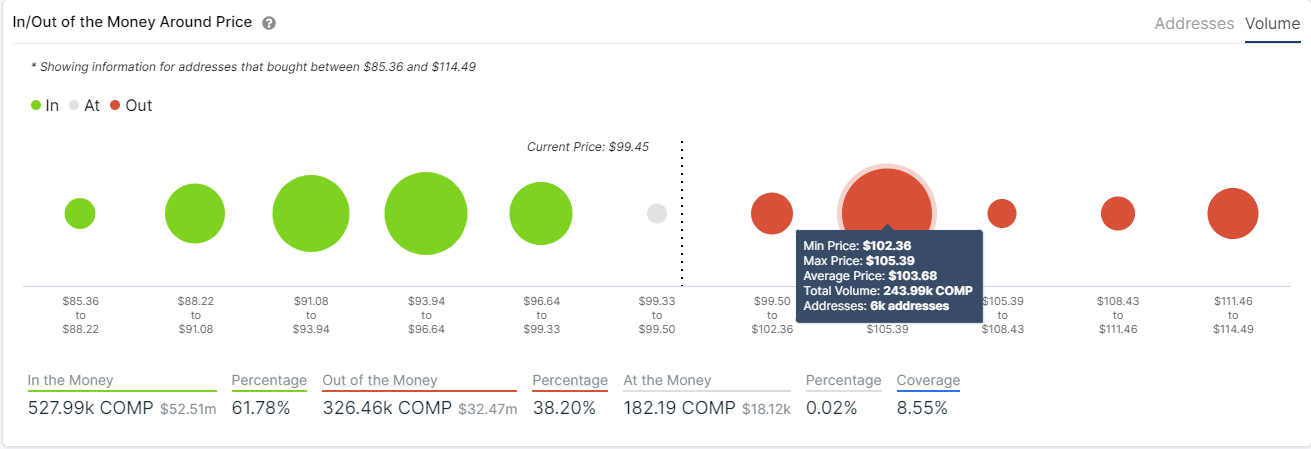
COMP IOMAP chart
However, the In/Out of the Money Around Price (IOMAP) chart shows a stiff resistance barrier between $102 and $105, where 6,000 addresses purchased close to 244,000 COMP tokens. The $102 level coincides with the 200-SMA on the 4-hour chart. Rejection from this resistance point can push Compound price towards $93.
Note: All information on this page is subject to change. The use of this website constitutes acceptance of our user agreement. Please read our privacy policy and legal disclaimer. Opinions expressed at FXstreet.com are those of the individual authors and do not necessarily represent the opinion of FXstreet.com or its management. Risk Disclosure: Trading foreign exchange on margin carries a high level of risk, and may not be suitable for all investors. The high degree of leverage can work against you as well as for you. Before deciding to invest in foreign exchange you should carefully consider your investment objectives, level of experience, and risk appetite. The possibility exists that you could sustain a loss of some or all of your initial investment and therefore you should not invest money that you cannot afford to lose. You should be aware of all the risks associated with foreign exchange trading, and seek advice from an independent financial advisor if you have any doubts.
Recommended Content
Editors’ Picks

Bitcoin Weekly Forecast: BTC nosedives below $95,000 as spot ETFs record highest daily outflow since launch
Bitcoin price continues to edge down, trading below $95,000 on Friday after declining more than 9% this week. Bitcoin US spot ETFs recorded the highest single-day outflow on Thursday since their launch in January.

Bitcoin crashes to $96,000, altcoins bleed: Top trades for sidelined buyers
Bitcoin (BTC) slipped under the $100,000 milestone and touched the $96,000 level briefly on Friday, a sharp decline that has also hit hard prices of other altcoins and particularly meme coins.

Solana Price Forecast: SOL’s technical outlook and on-chain metrics hint at a double-digit correction
Solana (SOL) price trades in red below $194 on Friday after declining more than 13% this week. The recent downturn has led to $38 million in total liquidations, with over $33 million coming from long positions.

SEC approves Hashdex and Franklin Templeton's combined Bitcoin and Ethereum crypto index ETFs
The SEC approved Hashdex's proposal for a crypto index ETF. The ETF currently features Bitcoin and Ethereum, with possible additions in the future. The agency also approved Franklin Templeton's amendment to its Cboe BZX for a crypto index ETF.

Bitcoin: 2025 outlook brightens on expectations of US pro-crypto policy
Bitcoin price has surged more than 140% in 2024, reaching the $100K milestone in early December. The rally was driven by the launch of Bitcoin Spot ETFs in January and the reduced supply following the fourth halving event in April.

Best Forex Brokers with Low Spreads
VERIFIED Low spreads are crucial for reducing trading costs. Explore top Forex brokers offering competitive spreads and high leverage. Compare options for EUR/USD, GBP/USD, USD/JPY, and Gold.