• Compound is in the initial phases of an uptrend after falling to all-time lows of $86.
  • The DeFi token could break out to $120 if the 100 SMA resistance is turned into support.

Compound bulls managed to wriggle themselves from a downtrend that has kept them hostage since early September. An all-time low of $86 awoke the buyers and encouraged them to take positions. Over the last three days, a remarkable move sent the decentralized finance (DeFi) token in an upward trajectory.

The bullish outlook

COMP is exchanging hands at $102.5 after a considerable spike above a descending parallel channel. Besides, the crypto is sitting on top of the 50 Simple Moving Average (SMA) after it flipped into support.

The Relative Strength Index (RSI) is also making a compelling move from the oversold area. The gradual approach from the overbought region adds credence to the bullish picture and encourages more buyers to join the market.

COMP/USD 4-hour chart

COMP/USD 4-hour chart

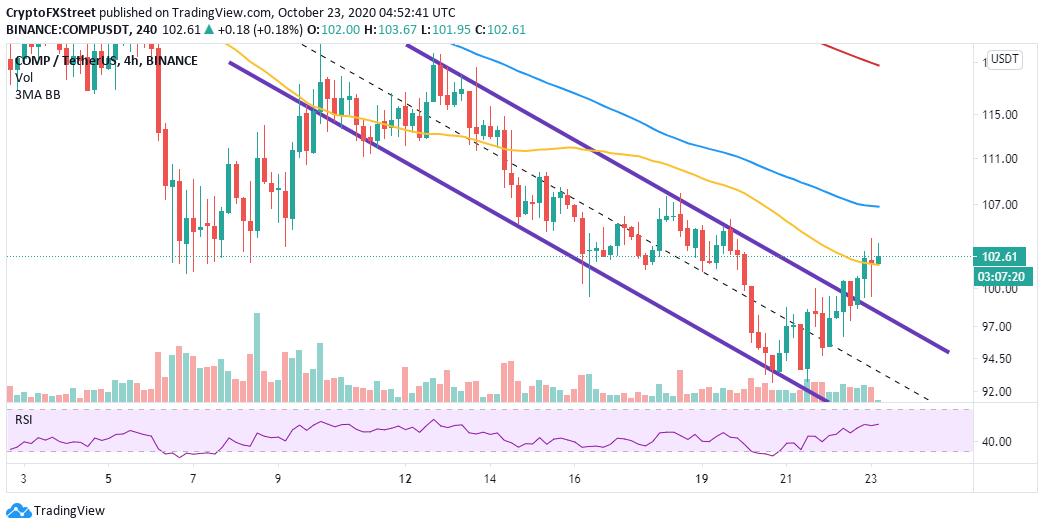
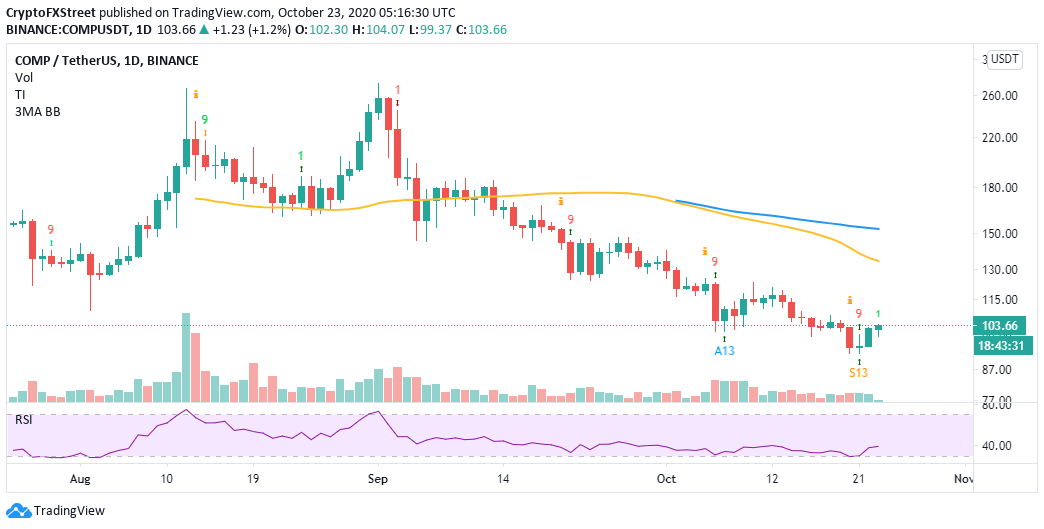
A broader look to the upside points to a potential breakout to the 100 SMA, which, if broken, might give COMP a boost to the 200 SMA. A buy signal presented by the TD Sequential Indicator on the daily chart adds weight to the bullish outlook. In other words, Compound could be at the beginning of an uptrend aiming for $120.

COMP/USD daily chart

COMP/USD daily chart

Compound is experiencing a surge in volume, according to the data provided by Santiment. The increase has been consistent since October 18 and seems to have hit a peak on October 22. Coincidentally, the price rallied from the all-time low, breaking above $100.

Social media mentions increased across multiple platforms but lagged behind the volume. As the bulls nurse the uptrend, the mentions are expected to make an upswing, succeeded by another swing upwards. Therefore, traders need to pay attention to these two metrics now that recovery is in the initial phases.

Compound social media mentions/volume chart

Compound social media mentions/volume chart

IntoTheBlock “Daily New Addresses” reinforces the bullish narrative with an increase in the number of newly-created addresses. A higher-high and a higher low pattern appears to be forming on the chart. In context, network growth is a bullish indicator for COMP as it improves the protocol’s inflow and outflow. In turn, optimum liquidity is created to support an uptrend in the price.

Compound new addresses chart

Compound new addresses chart

Looking at the other side of the picture

According to the IOMAP model, COMP/USD is heading into a challenging area due to the supply created by addresses that previously bought approximately 137,000 COMP between $107 and $110. A reversal is likely to take place on testing this resistance zone.

 Compound IOMAP chart

COMP IOMAP chart

On the flip side, immense support above $100 suggests that consolidation is the most probable price action before a breakout occurs. Meanwhile, the most robust buyer congestion zone runs from $103 to $104. Here, nearly 2,300 addresses previously bought roughly 103,000 COMP.


Information on these pages contains forward-looking statements that involve risks and uncertainties. Markets and instruments profiled on this page are for informational purposes only and should not in any way come across as a recommendation to buy or sell in these assets. You should do your own thorough research before making any investment decisions. FXStreet does not in any way guarantee that this information is free from mistakes, errors, or material misstatements. It also does not guarantee that this information is of a timely nature. Investing in Open Markets involves a great deal of risk, including the loss of all or a portion of your investment, as well as emotional distress. All risks, losses and costs associated with investing, including total loss of principal, are your responsibility. The views and opinions expressed in this article are those of the authors and do not necessarily reflect the official policy or position of FXStreet nor its advertisers. The author will not be held responsible for information that is found at the end of links posted on this page.

If not otherwise explicitly mentioned in the body of the article, at the time of writing, the author has no position in any stock mentioned in this article and no business relationship with any company mentioned. The author has not received compensation for writing this article, other than from FXStreet.

FXStreet and the author do not provide personalized recommendations. The author makes no representations as to the accuracy, completeness, or suitability of this information. FXStreet and the author will not be liable for any errors, omissions or any losses, injuries or damages arising from this information and its display or use. Errors and omissions excepted.

The author and FXStreet are not registered investment advisors and nothing in this article is intended to be investment advice.

Recommended content


Recommended Content

Editors’ Picks

Dozens of crypto-related ETFs await SEC approval, among them those related to XRP, Litecoin, and Solana

Dozens of crypto-related ETFs await SEC approval, among them those related to XRP, Litecoin, and Solana

Eric Balchunas, Senior ETF Analyst for Bloomberg, highlights 72 crypto-related ETFs awaiting SEC approval. The diversity of these ETFs encompasses major cryptocurrencies, such as XRP, Litecoin, and Solana, as well as meme-based memecoins.

Aptos price extends gains on broader crypto market recovery, presence in Osaka expo

Aptos price extends gains on broader crypto market recovery, presence in Osaka expo

APT token rises for the second consecutive day amid a widespread crypto recovery and expectations of growing adoption. Aptos powers the official digital wallet of Expo 2025 in Osaka, processing over 588,000 transactions with 133,000 new accounts.

Bitcoin bullish momentum builds as premium exceeds 9% for first time in three months

Bitcoin bullish momentum builds as premium exceeds 9% for first time in three months

Bitcoin price is extending its gains, trading above $94,000 at the time of writing on Wednesday, following a two-day rally of 9.75% so far this week. BTC rally gathers momentum as trade war fears ease, following US President Donald Trump’s downplaying of tensions with China.

Solana and Sui surge, igniting interest in DeFi as TVL rebounds

Solana and Sui surge, igniting interest in DeFi as TVL rebounds

Altcoins like Solana (SOL) and Sui gain strength on Wednesday, buoyed by several factors, including a significant recovery in the networks' Total Value Locked (TVL) in Decentralized Finance (DeFi).

Bitcoin Weekly Forecast: BTC holds steady, Fed warns of tariffs’ impact, as Gold hits new highs 

Bitcoin Weekly Forecast: BTC holds steady, Fed warns of tariffs’ impact, as Gold hits new highs 

Bitcoin price consolidates above $84,000 on Friday, a short-term support that has gained significance this week. The world's largest cryptocurrency by market capitalization continued to weather storms caused by US President Donald Trump's incessant trade war with China after pausing reciprocal tariffs for 90 days on April 9 for other countries. 

Read full analysis
The Best brokers to trade EUR/USD

The Best brokers to trade EUR/USD

SPONSORED Discover the top brokers for trading EUR/USD in 2025. Our list features brokers with competitive spreads, fast execution, and powerful platforms. Whether you're a beginner or an expert, find the right partner to navigate the dynamic Forex market.

Read More

BTC

ETH

XRP