![]() Lorenzo Stroe
Lorenzo Stroe
Independent Analyst
- Compound price is on its way to hit $250 as there is very little resistance to the upside.
- The digital asset has broken out of a critical bullish pattern on the 1-hour chart.
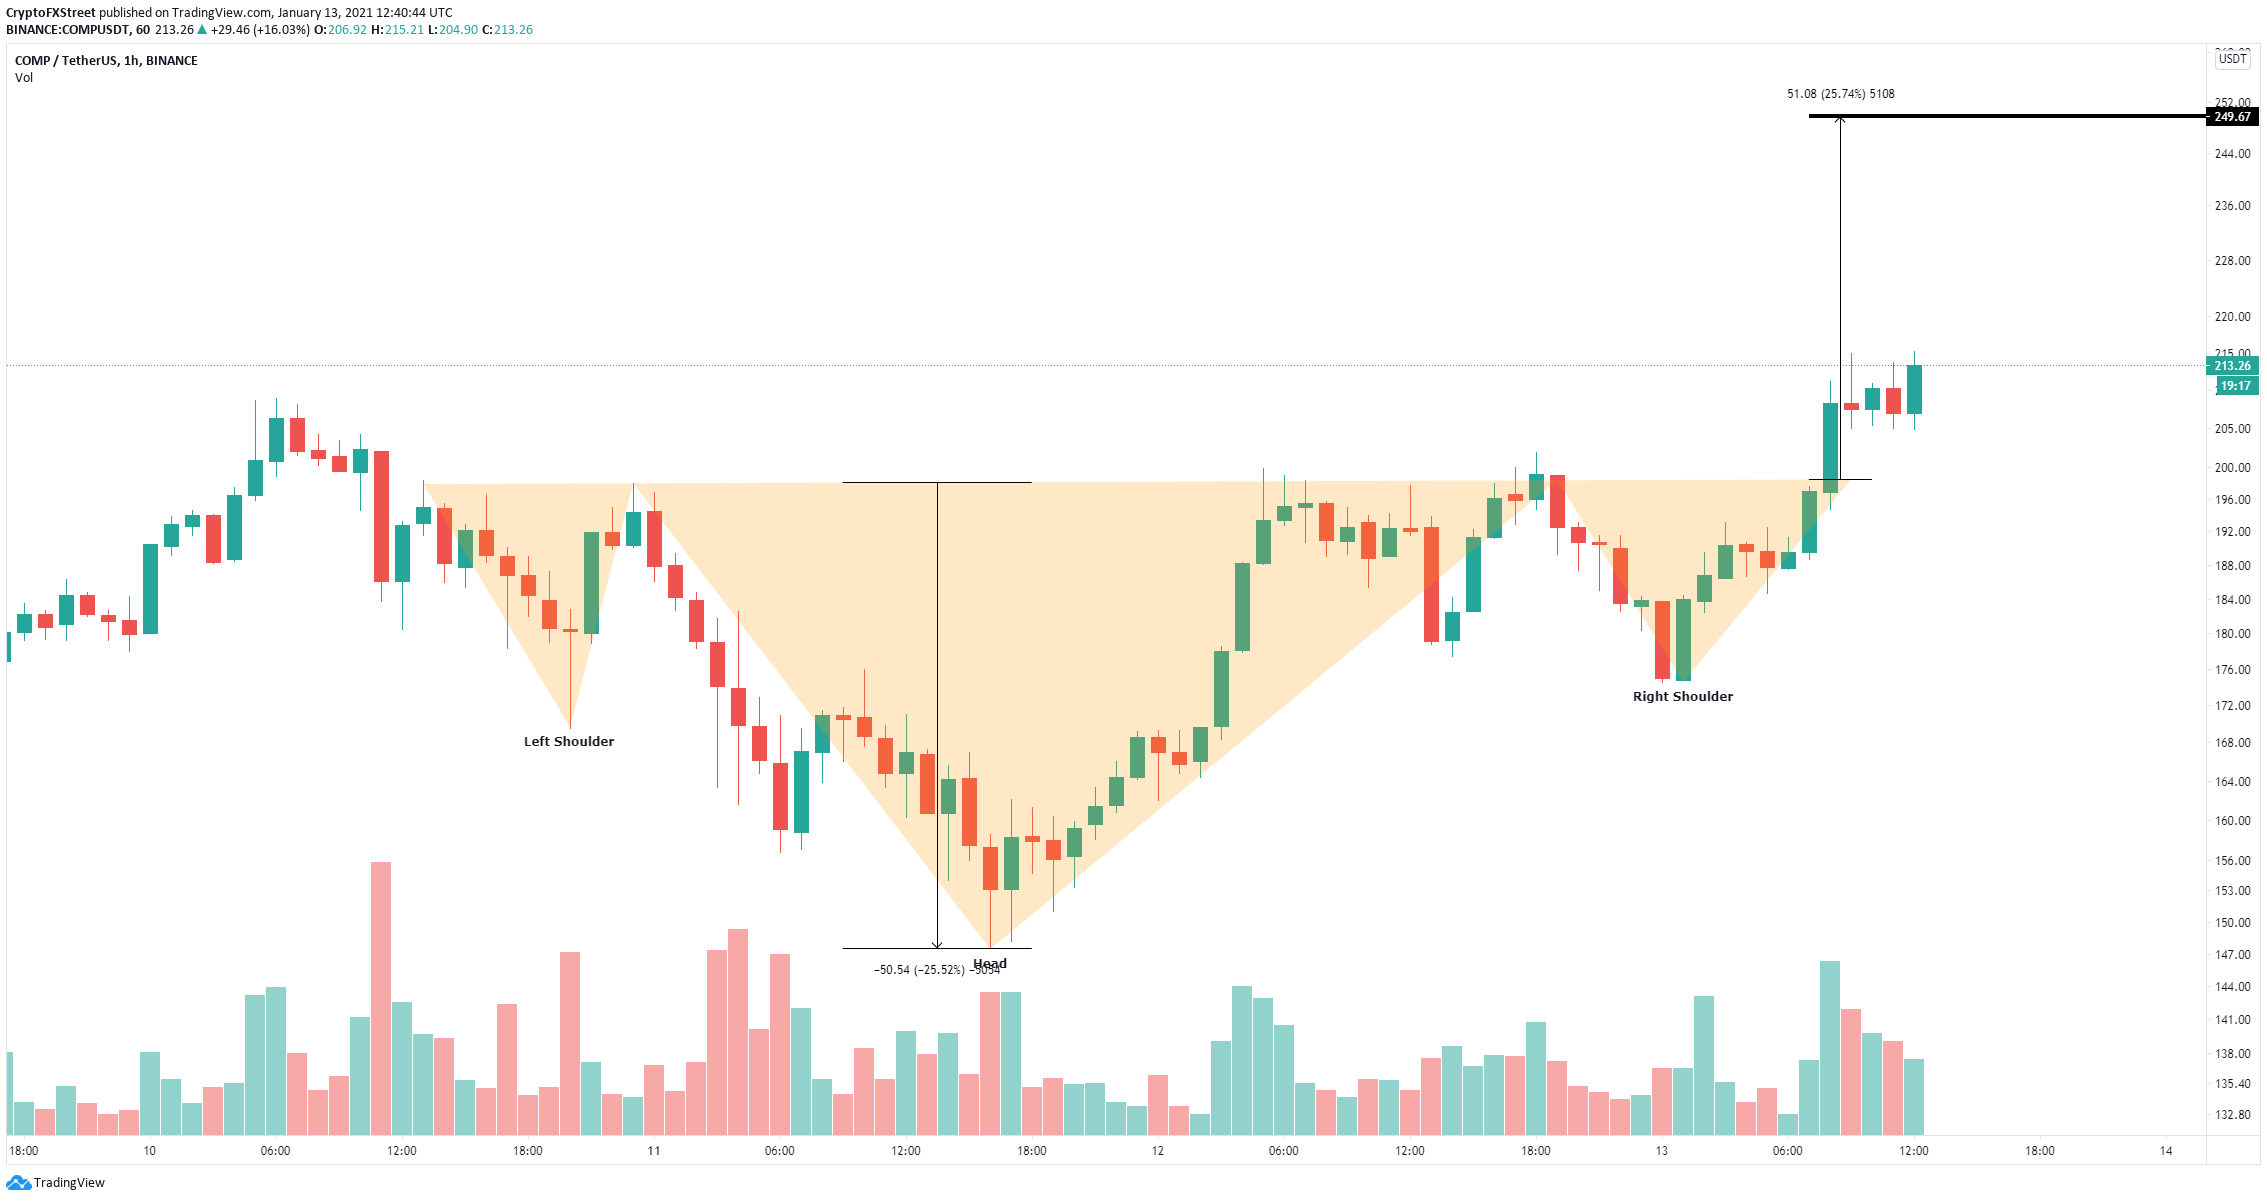
Compound has been trading inside a reverse head and shoulders pattern on the hourly chart since January 10. Finally, COMP had a breakout above the neckline resistance level at $198 while bulls target $250.
Compound price faces almost no opposition towards $250
On the hourly chart, Compound bulls have managed to push the digital asset above the critical resistance level at $198 which was the neckline of the head and shoulders pattern. The breakout took Compound price up to $214.
COMP/USD 1-hour chart
Using the height of the pattern as a reference point, it can be determined that the bullish price target is $250. According to various metrics, there is very little resistance towards this level.
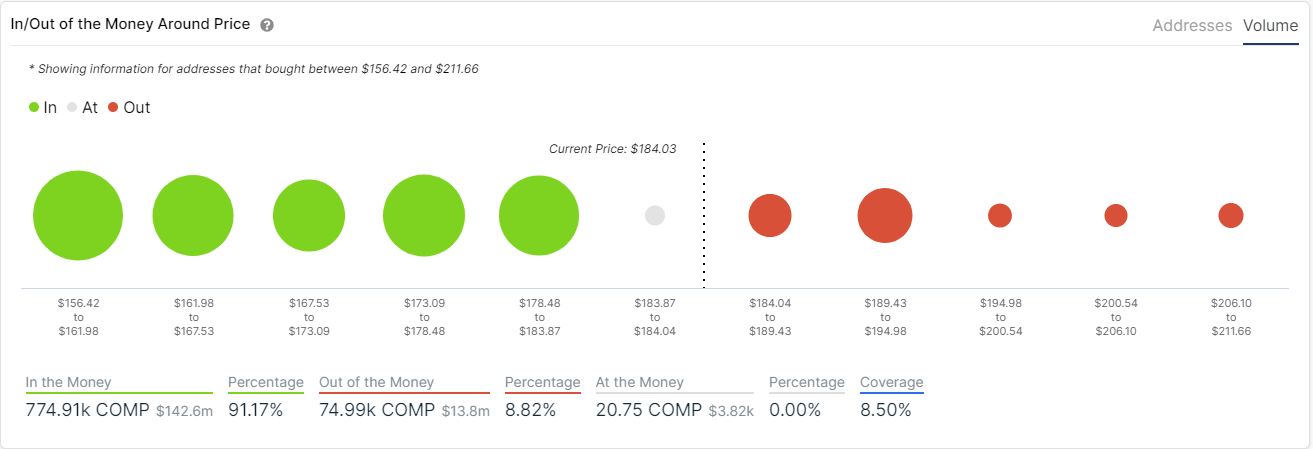
COMP IOMAP chart
The In/Out of the Money Around Price (IOMAP) chart showed the strongest resistance area to be located between $189 and $194. Above that point there seems to be almost no opposition.
%20[13.56.22,%2013%20Jan,%202021]-637461398862921134.png)
COMP Holders Distribution chart
Additionally, the number of whales holding between 10,000 and 100,000 COMP has been increasing significantly since December 2020 from a low of 55 to 62 currently. This indicates that large holders are extremely interested in buying the digital asset despite the rise in price in the same time period.
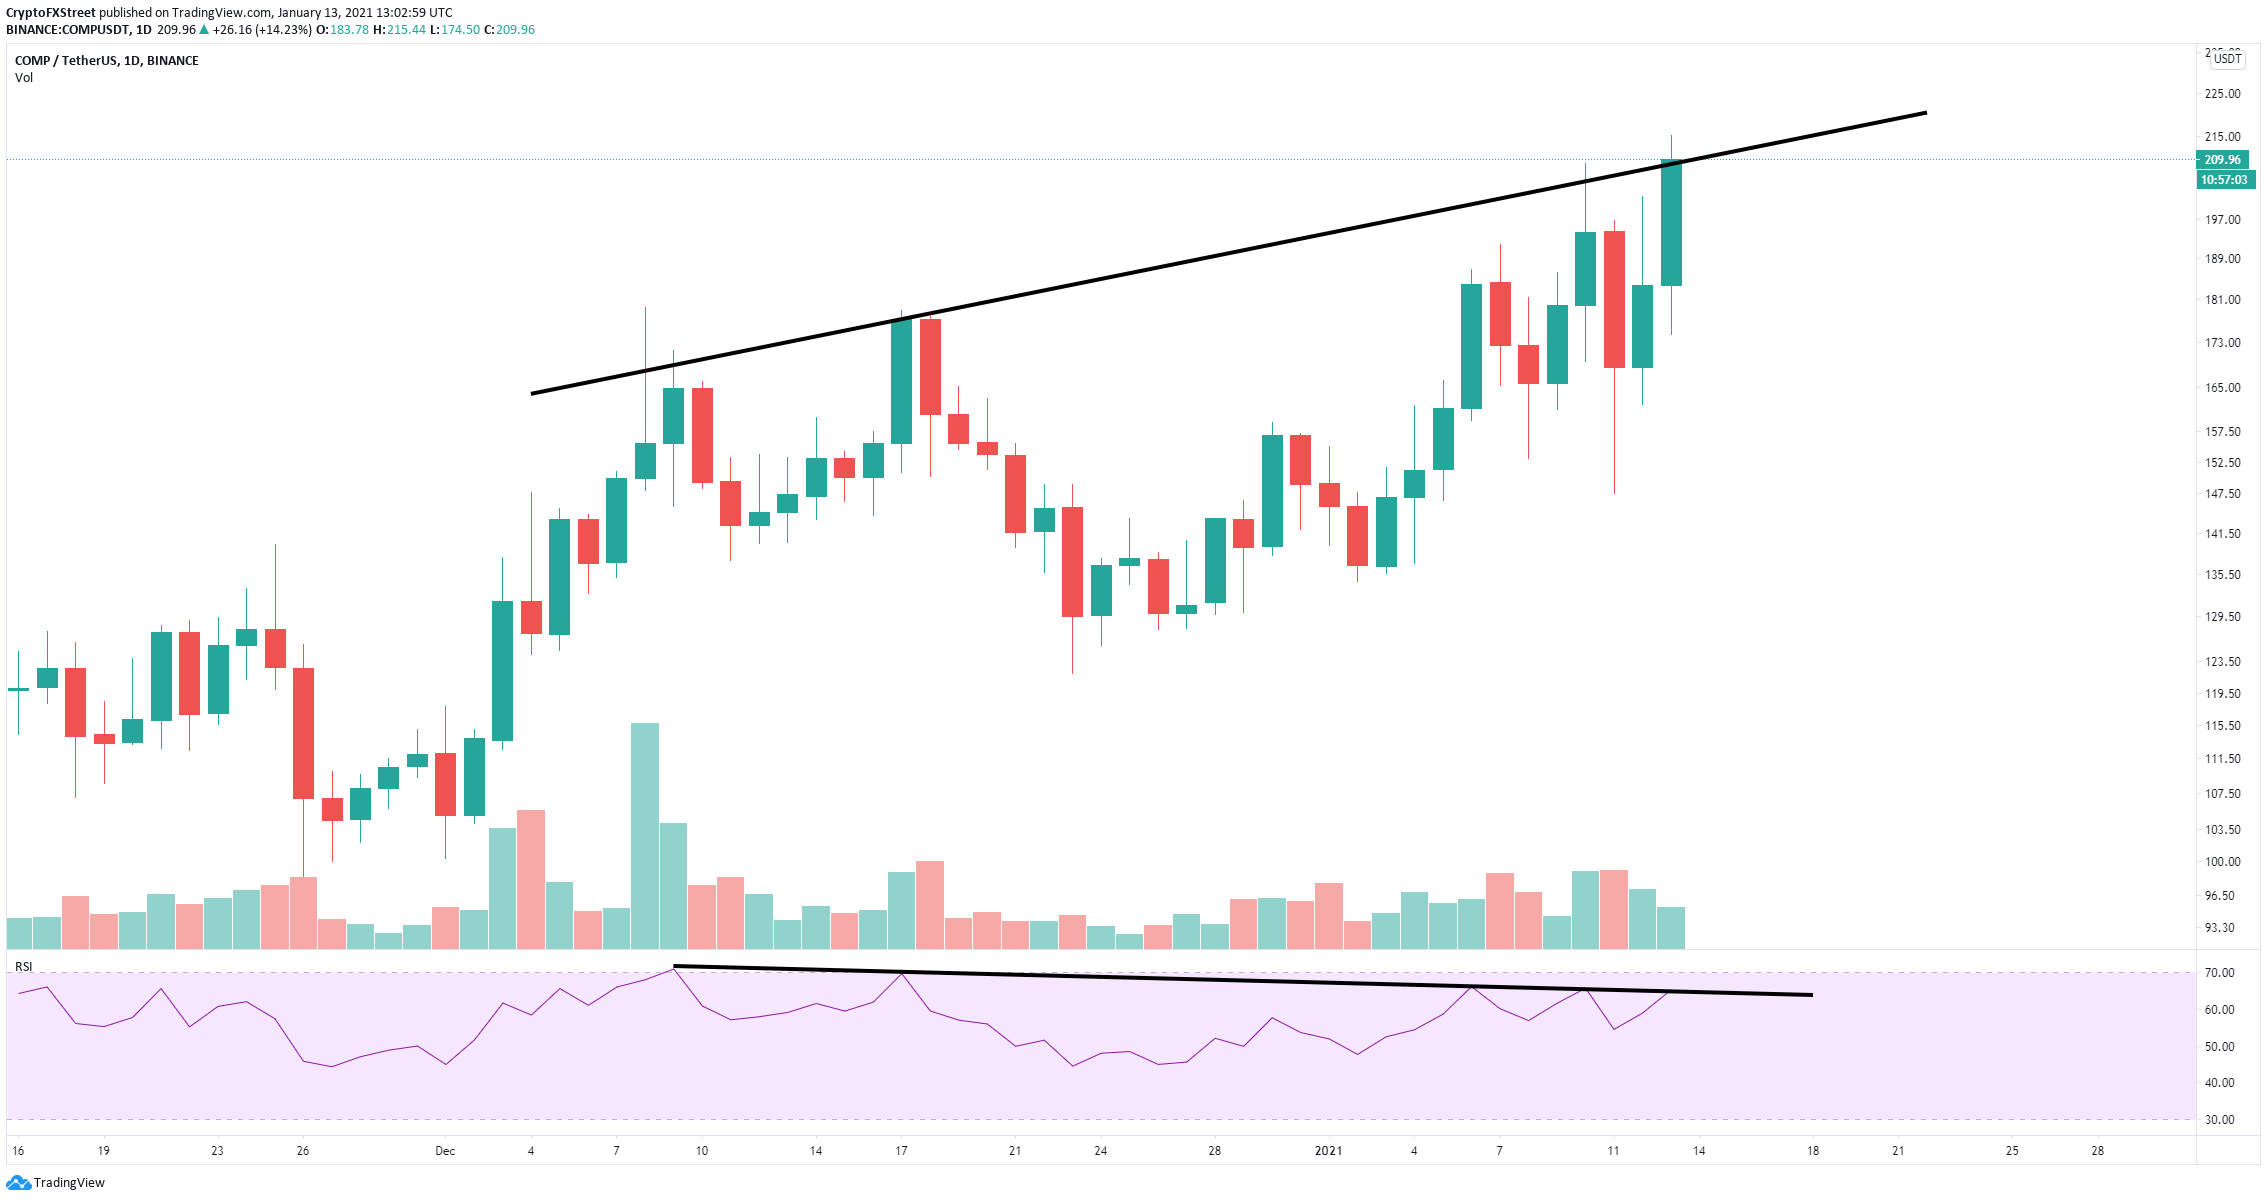
COMP/USD daily chart
However, on the daily chart, the RSI and the price of COMP have formed a bearish divergence. Compound price has established higher highs while the RSI formed lower highs. Additionally, every time the RSI is close to overextended, COMP suffers a pullback.
Note: All information on this page is subject to change. The use of this website constitutes acceptance of our user agreement. Please read our privacy policy and legal disclaimer. Opinions expressed at FXstreet.com are those of the individual authors and do not necessarily represent the opinion of FXstreet.com or its management. Risk Disclosure: Trading foreign exchange on margin carries a high level of risk, and may not be suitable for all investors. The high degree of leverage can work against you as well as for you. Before deciding to invest in foreign exchange you should carefully consider your investment objectives, level of experience, and risk appetite. The possibility exists that you could sustain a loss of some or all of your initial investment and therefore you should not invest money that you cannot afford to lose. You should be aware of all the risks associated with foreign exchange trading, and seek advice from an independent financial advisor if you have any doubts.
Recommended Content
Editors’ Picks

Bitcoin Weekly Forecast: BTC nosedives below $95,000 as spot ETFs record highest daily outflow since launch
Bitcoin price continues to edge down, trading below $95,000 on Friday after declining more than 9% this week. Bitcoin US spot ETFs recorded the highest single-day outflow on Thursday since their launch in January.

Bitcoin crashes to $96,000, altcoins bleed: Top trades for sidelined buyers
Bitcoin (BTC) slipped under the $100,000 milestone and touched the $96,000 level briefly on Friday, a sharp decline that has also hit hard prices of other altcoins and particularly meme coins.

Solana Price Forecast: SOL’s technical outlook and on-chain metrics hint at a double-digit correction
Solana (SOL) price trades in red below $194 on Friday after declining more than 13% this week. The recent downturn has led to $38 million in total liquidations, with over $33 million coming from long positions.

SEC approves Hashdex and Franklin Templeton's combined Bitcoin and Ethereum crypto index ETFs
The SEC approved Hashdex's proposal for a crypto index ETF. The ETF currently features Bitcoin and Ethereum, with possible additions in the future. The agency also approved Franklin Templeton's amendment to its Cboe BZX for a crypto index ETF.

Bitcoin: 2025 outlook brightens on expectations of US pro-crypto policy
Bitcoin (BTC) price has surged more than 140% in 2024, reaching the $100K milestone in early December. The rally was driven by the launch of Bitcoin Spot Exchange Traded Funds (ETFs) in January and the reduced supply following the fourth halving event in April.

Best Forex Brokers with Low Spreads
VERIFIED Low spreads are crucial for reducing trading costs. Explore top Forex brokers offering competitive spreads and high leverage. Compare options for EUR/USD, GBP/USD, USD/JPY, and Gold.