• Polkadot price has experienced unprecedented growth in the past week hitting a market capitalization of $16 billion.
  • Many investors, however, are concerned about a potential massive crash like happened to EOS. 

Polkadot is known as the Ethereum Killer and although started trading in 2020, quickly reached a market capitalization of $4 billion. This blockchain protocol offers a high throughput and low-cost transactions, but what does make DOT different than any of the other Ethereum competitors like EOS?

EOS is a platform that was designed to allow developers to build decentralized applications on it. The digital asset had an amazing start reaching a market capitalization of $17 billion in April 2018. Nevertheless, shortly after, its price plummeted down to $1.8 from the $21 all-time high and never managed to recover. 

New report states Polkadot’s fate will be similar to EOS

According to a recent Chinese report published on the WeChat platform, Polkadot might be just hyped up from China just like EOS. The article states: 

We conducted some surveys based on the Polkadot ecological project summary compiled by Bikan, and found that in addition to DOT and Kusama, the remaining 11 ecological projects include ANKR, ChainX, Polar Region, Celer, Darwinia/KTON, Phala, MantraDAO and Eight projects, including Crust, have Chinese capital behind them, which can be said to account for half of the current Polkadot ecological hot projects.

Additionally, it seems that MantraDAO has been already investigated for serious fraud. The article also references EOS price growth back in 2017 and 2018 and its similarities to the current price action of Polkadot.    

It’s also important to note that Polkadot markets itself as an Ethereum Killer. However, ETH 2.0 should be released within the next two years which would make Polkadot somewhat useless. 

dot price

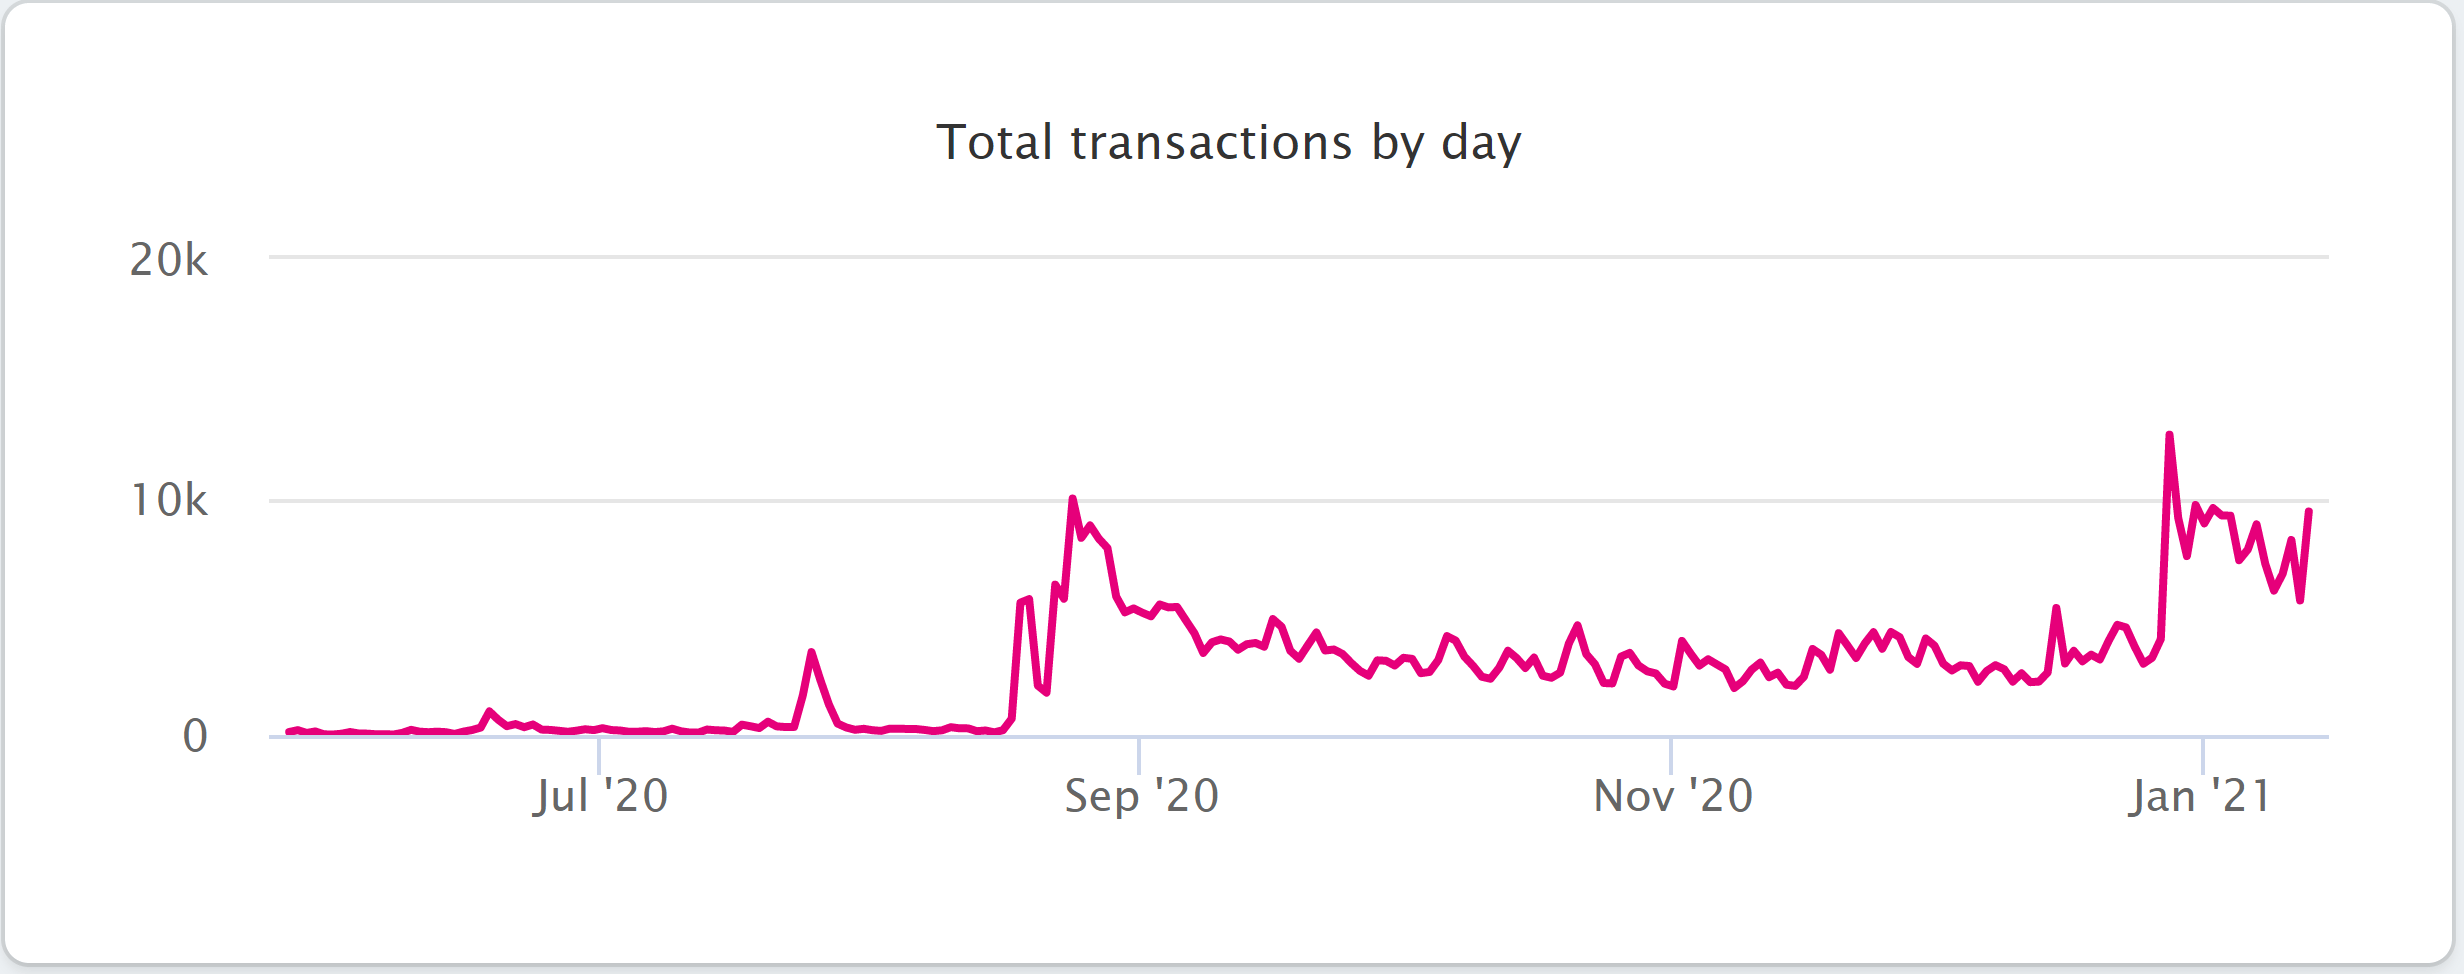
Polkadot Transactions chart

What’s even more interesting is the number of transactions on the Polkadot network. Despite hitting a new high on December 28, 2020, at 12,619 transactions in a day, this number is still minuscule in comparison to Ethereum’s transactions, seeing an average of 1.1 million per day.

dot price

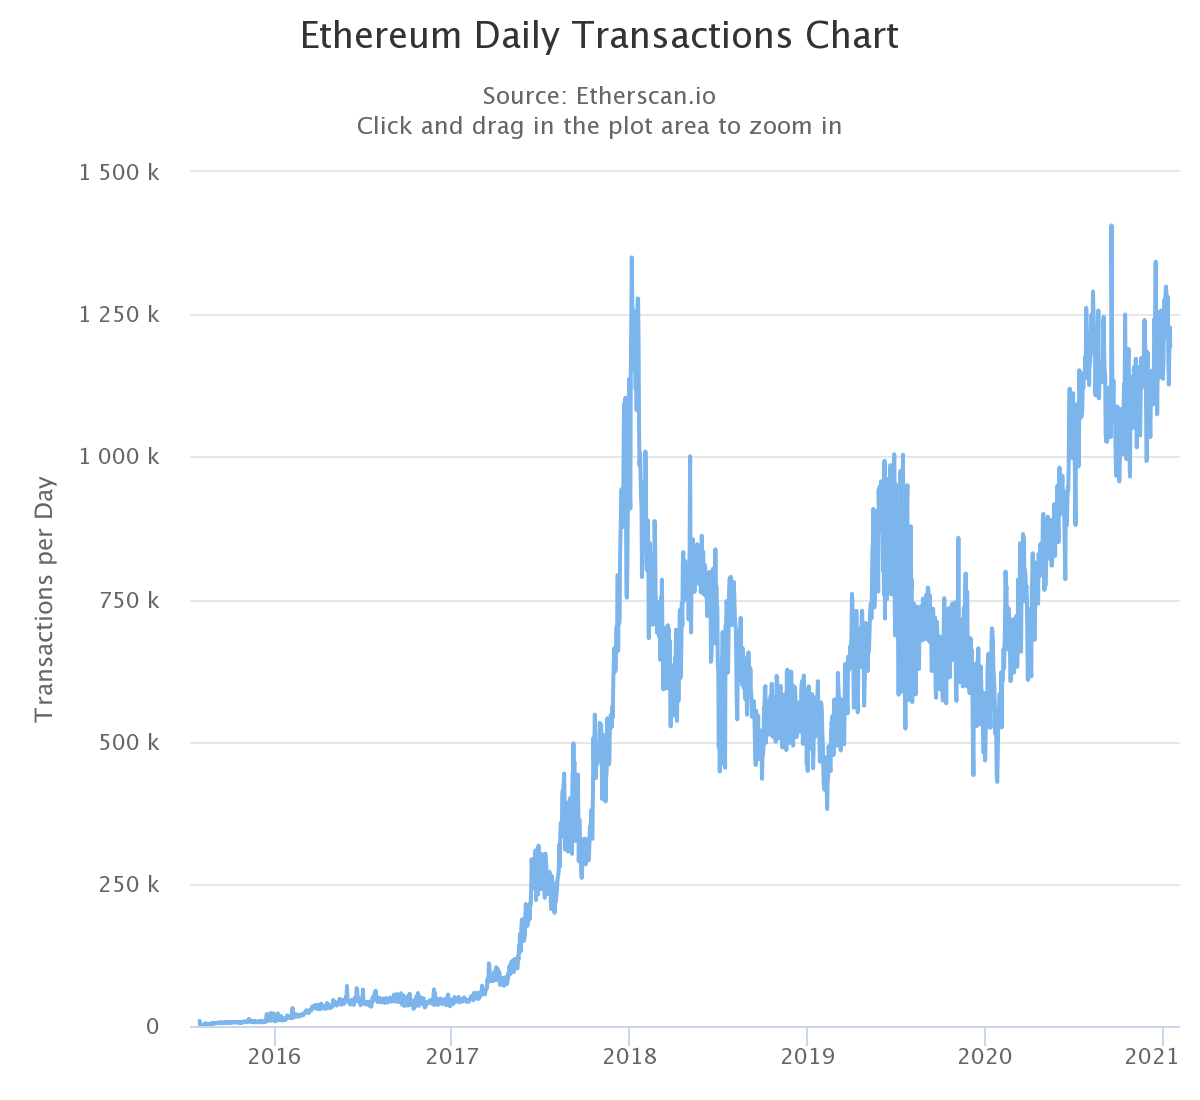
Ethereum transactions chart

In fact, even in January 2017, when Ethereum price was roughly $10 with a market capitalization of $1 billion, the network still had an average of 50,000 transactions per day, which is almost five times higher than Polkadot’s best day. 


Note: All information on this page is subject to change. The use of this website constitutes acceptance of our user agreement. Please read our privacy policy and legal disclaimer. Opinions expressed at FXstreet.com are those of the individual authors and do not necessarily represent the opinion of FXstreet.com or its management. Risk Disclosure: Trading foreign exchange on margin carries a high level of risk, and may not be suitable for all investors. The high degree of leverage can work against you as well as for you. Before deciding to invest in foreign exchange you should carefully consider your investment objectives, level of experience, and risk appetite. The possibility exists that you could sustain a loss of some or all of your initial investment and therefore you should not invest money that you cannot afford to lose. You should be aware of all the risks associated with foreign exchange trading, and seek advice from an independent financial advisor if you have any doubts.

Join Telegram

Recommended content


Recommended Content

Editors’ Picks

Ripple on-chain metrics show bullish signs amidst legal struggle with SEC, XRP eyes recovery

Ripple on-chain metrics show bullish signs amidst legal struggle with SEC, XRP eyes recovery

Ripple made a comeback above $0.48 on Tuesday and hovers above that level in Wednesday’s European session. Ripple on-chain metrics such as transaction volume and Network Realized Profit/Loss have turned bullish, supporting a recovery in the altcoin. 

More Ripple News

Bitcoin price falls amidst German government transfers, miners activity

Bitcoin price falls amidst German government transfers, miners activity

Bitcoin (BTC) extends correction on Wednesday and hovers around $61,000 after finding resistance near the $64,000 level on Monday. Recent on-chain data indicates heightened selling activity from Bitcoin miners early in the week. 

More Bitcoin News

Crypto Today: Bitcoin erases gains from end of June, Ethereum declines while Ripple holds

Crypto Today: Bitcoin erases gains from end of June, Ethereum declines while Ripple holds

Bitcoin wipes out gains from the last week of June and falls below $60,000 on Wednesday. Ethereum and top altcoins ranked by market capitalization erased gains as the inflation outlook worsened. Ripple holds on to recent gains and hovers above $0.48 on Wednesday. 

More Cryptocurrencies News

Three reasons why altcoins could shake off losses this week

Three reasons why altcoins could shake off losses this week

On-chain data from Santiment shows that altcoins are currently in the opportunity zone, or generating buy signals. The top three altcoins in the buy zone are Basic Attention Token (BAT), Chromia (CHR), and Highstreet (HIGH), per Santiment. 

More Altcoins News

Bitcoin: BTC price correction could end in July, according to seasonal data

Bitcoin: BTC price correction could end in July, according to seasonal data

Bitcoin (BTC) price appears poised for a decline this week, influenced by slight outflows in US spot ETFs, selling activity among BTC miners, and a combined transfer of 4,690.28 BTC to centralized exchanges by the US and German governments.

Read full analysis

BTC

ETH

XRP