Chainlink price will crash to $22 based on extremely accurate technical index
- Chainlink price is on a corrective path after the TD Sequential indicator flashed a sell signal on Tuesday.
- History shows that this sell signal yields an average drop of 34%, which puts LINK's potential target at $22.
- A bullish scenario might develop if the price manages to close above the all-time high at $35.6, formed on February 14.
-637336005550289133_XtraLarge.jpg)
Chainlink price rally took a beating on Monday due to a sell-off. While the price recovered for a brief moment, the bearish pressure forced the oracle token even lower.
At the time of writing, LINK is trading just above the $30 level, with sellers eyeing a lower low.
Chainlink price tumbles as bears rampage
Chainlink price seems to have reversed since hitting a peak of $35.70 on February 14. The Tom DeMark (TD) Sequential indicator flashed a sell-signal in the form of a red-nine candlestick on Tuesday.
Therefore, the temporary downturn could turn into an extended corrective wave as this TD setup forecasts a one-to-four candlestick correction.
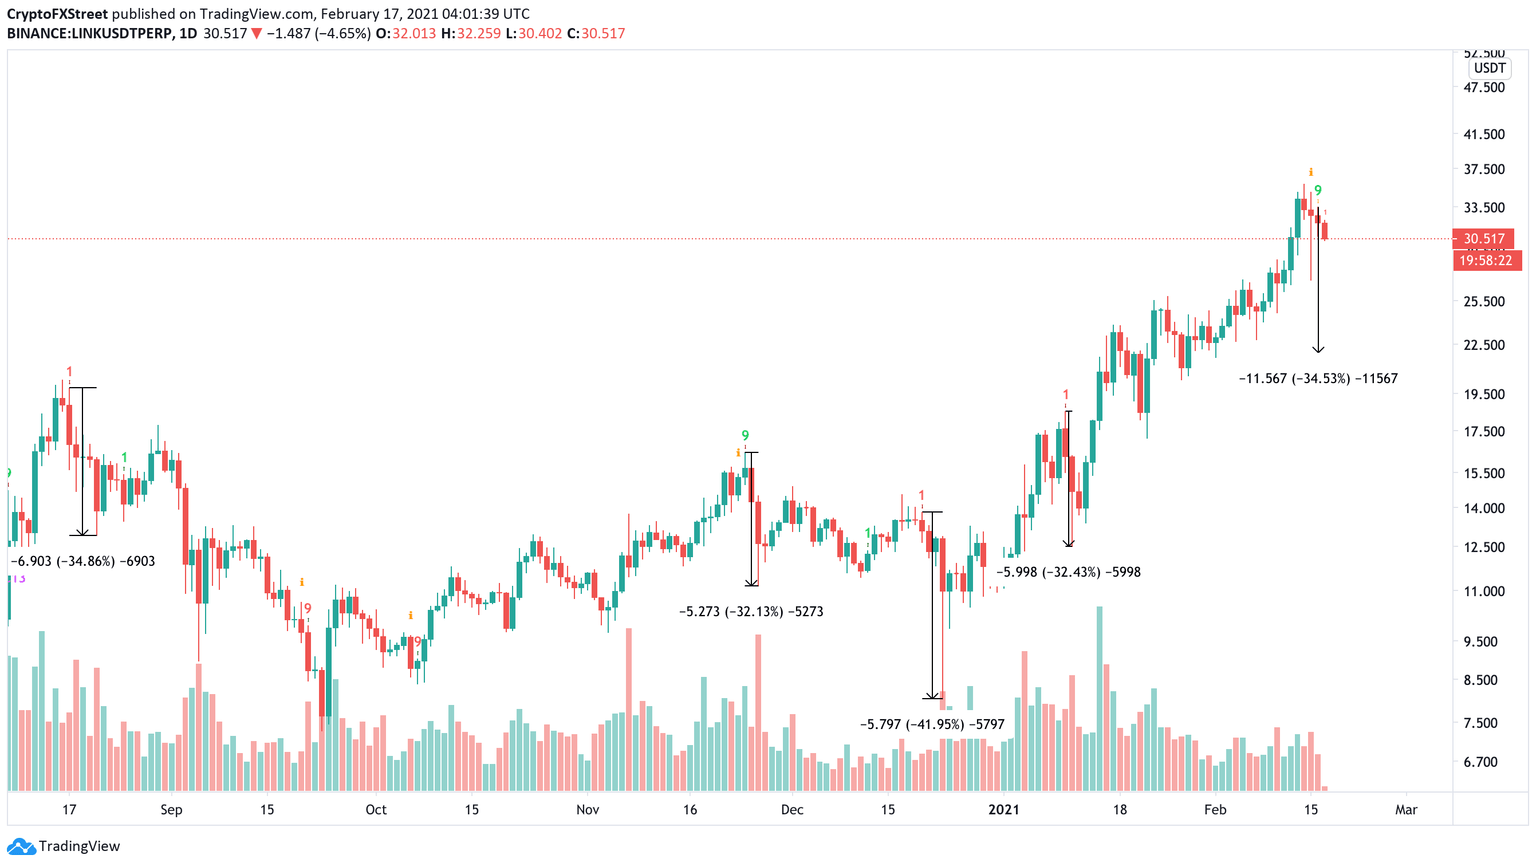
LINK/USDT 1-day chart
Interestingly, LINK dropped nearly 34% the last four times the TD Sequential indicator flashed a sell signal. If history were to repeat, then a 34% correction would put Chainlink at $22.5.
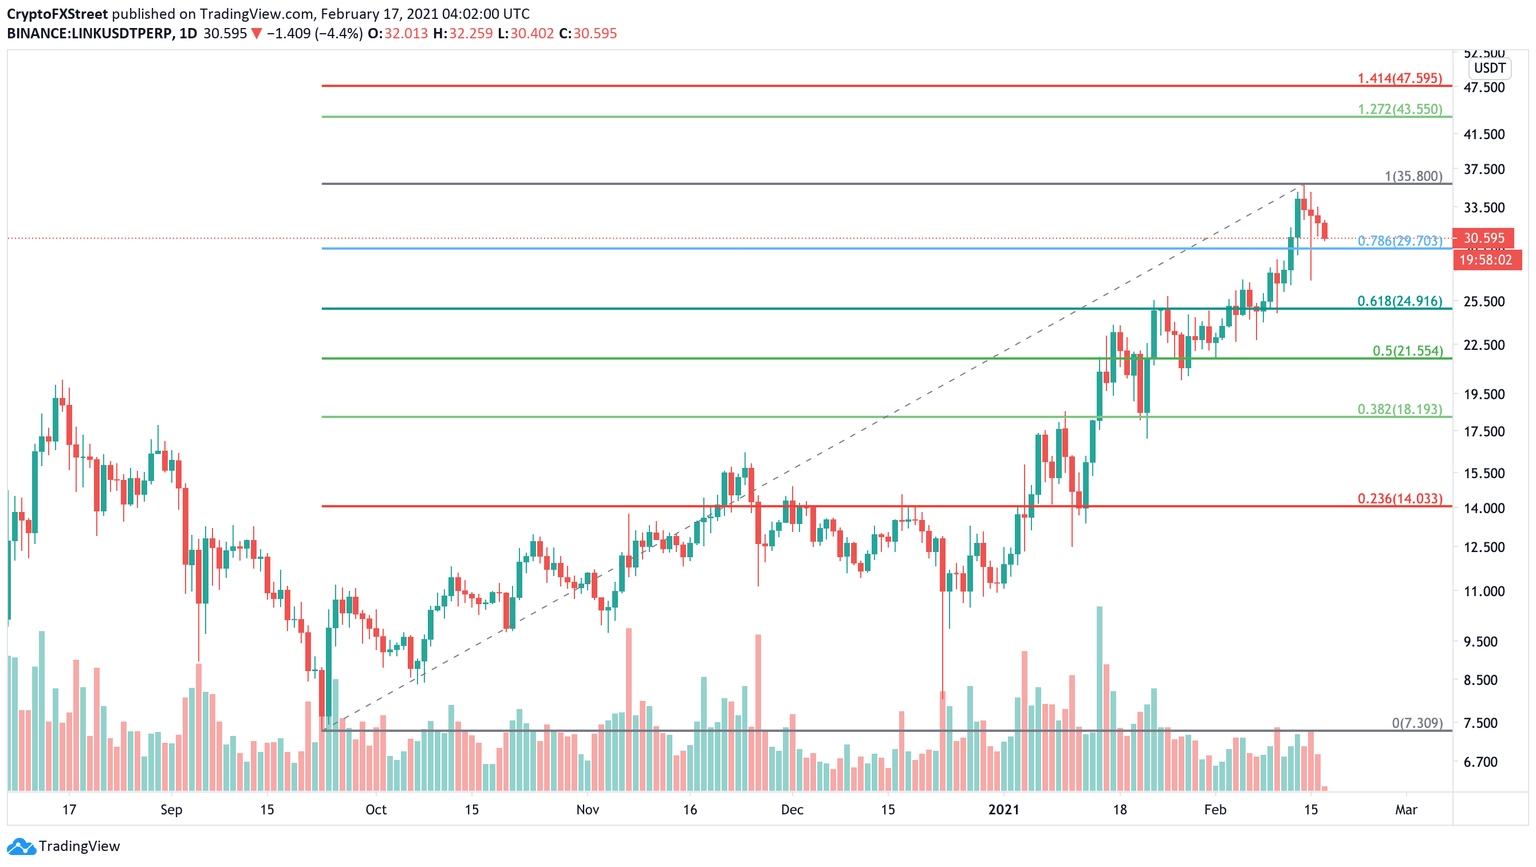
LINK/USDT 1-day chart
While it does seem like a drop here is a no-brainer, investors should be wary of an upswing. The bullish scenario seems likely especially considering the recent activity among Chainlink whales.
Chainlink's on-chain transaction volume saw two distinctive spikes on February 15. These whales transferred 2.53 million and 2.28 million LINK to staking addresses.
The transfers paint an undeniably bullish outcome for LINK, as it means that whales are not ready to book profits yet.
%2520%5B14.10.41%2C%252017%2520Feb%2C%25202021%5D-637491481003574448.png&w=1536&q=95)
Chainlink Transaction Volume chart
Hence, the support barrier at 78.6% Fibonacci retracement level at $29.5 could absorb short-term selling pressure, putting an end to the downswing.
Increased buying pressure here leading to a close above the local top at $35.70 will invalidate LINK's bearish thesis and rally up to the 141.40% Fibonacci level or at $47.60.
Author

Akash Girimath
FXStreet
Akash Girimath is a Mechanical Engineer interested in the chaos of the financial markets. Trying to make sense of this convoluted yet fascinating space, he switched his engineering job to become a crypto reporter and analyst.


