![]() Sheldon McIntyre, CMT
Sheldon McIntyre, CMT
Independent Analyst
- Chainlink price strength puts bulls back on the bandwagon.
- LINK/BTC ratio shaping a bullish cup-with-handle pattern.
- IOMAP data reveals 74% of addresses are in the money, offering a firm source of support.
Chainlink price has rebounded to the descending channel’s upper trend line, wedging LINK into a corner just above the top of a price congestion range that began in February. Upside may be limited in the short-term as the altcoin consolidates in a tight range, but there is a high probability that the current situation will resolve to the upside.
Chainlink price bolstered by on-chain metric
A close look at the Intotheblock In/Out of the Money Around Price (IOMAP) data exposes a large number of in-the-money addresses beginning at $34.69 and extending down to $30.38, positioning LINK to withstand any short term selling pressure comfortably.
The 66.92k addresses owning 65.24 million LINK stands in contrast to the marginal amount of out-of-the-money addresses, putting Chainlink price in an optimal position to absorb some selling before quickly breaking through the descending channel’s upper trend line.
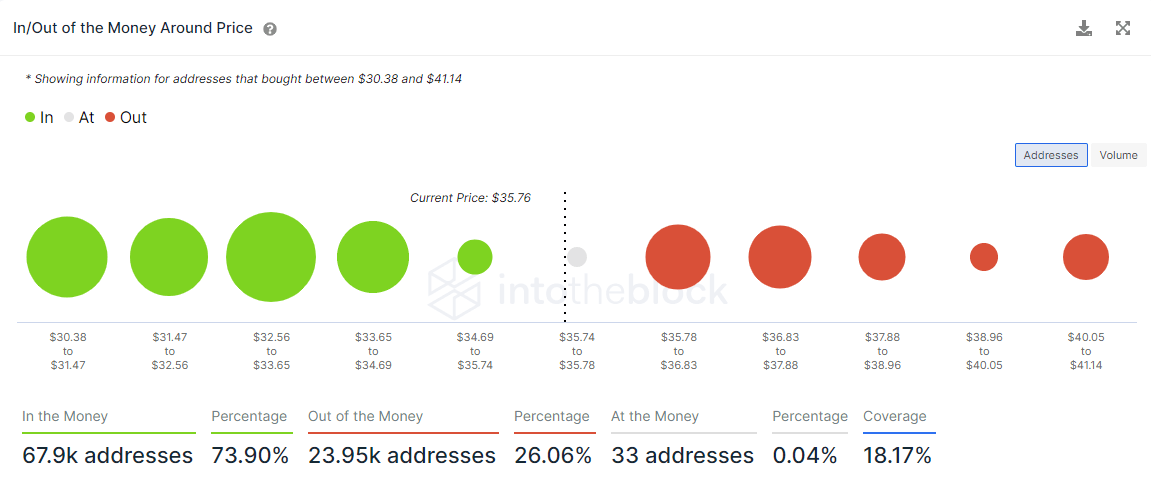
LINK IOMAP data
LINK/BTC price pattern points to a window of opportunity for Chainlink speculators
Relative strength is fundamental to generating alpha, and how a cryptocurrency trades against BTC reveals when those windows of outperformance may emerge. Currently, LINK/BTC is shaping the handle of a bullish cup-with-handle pattern on the daily chart. If the pattern resolves to the upside and based on the measured move target, LINK will outperform BTC by almost 50% in the coming weeks or months.
It is not a far-fetched outlook for LINK/BTC considering the breakneck speed of projects adopting LINK’s decentralized oracle network to provide input on various external sources of data.
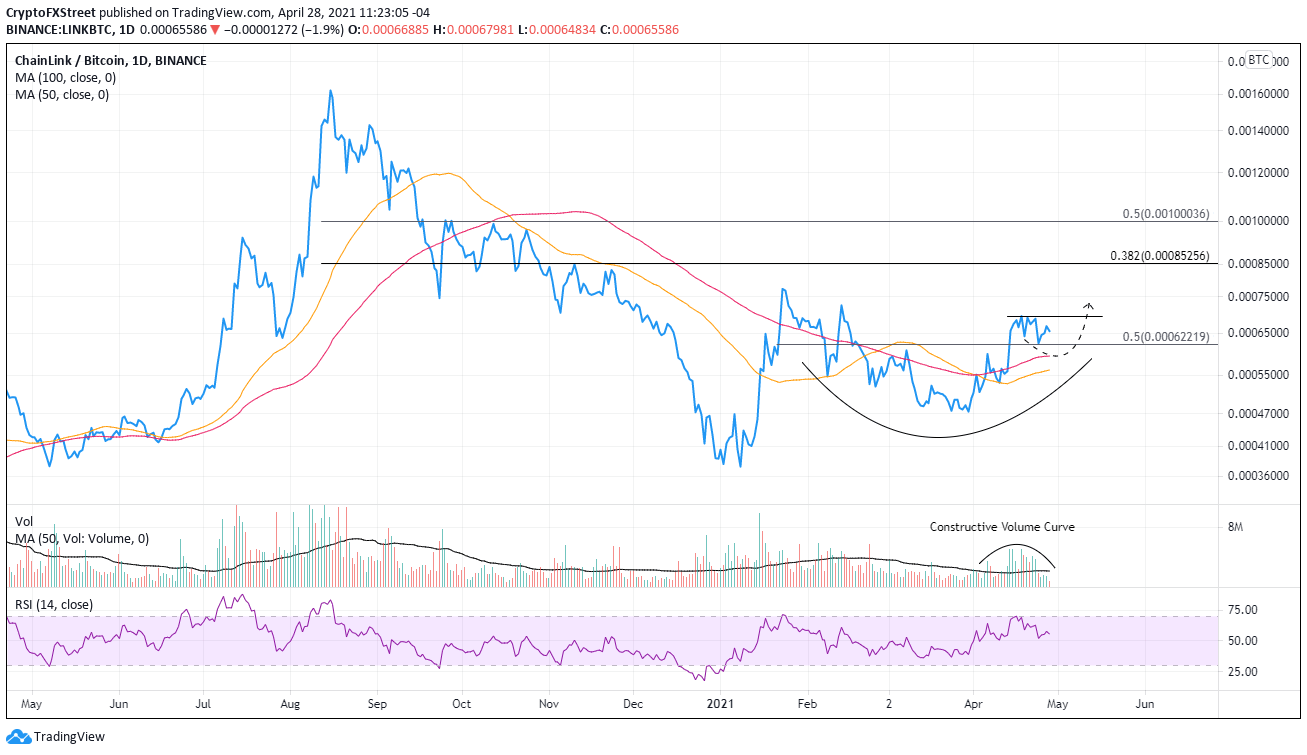
LINK/BTC daily chart
Chainlink price at a pivotal threshold in the road to overcoming topside trendline
A quick review of the 12-hour chart below emphasizes the delicate position of LINK in the charts. The digital token has been forced into a corner by the upper range of price congestion and the channel’s upper trend line.
Using the on-chain metrics mentioned above combined with the chart’s technicals, it is possible to deliver a mildly bullish outlook for Chainlink price, but maybe after some consolidation.
Resistance begins at the channel’s upper trend line at $37.19, followed by the 261.8% Fibonacci extension of the August-September 2020 correction at $40.53. The significant resistance is at the topside trend line beginning in 2019 and running through 2020 high, and most recently, the February high. It currently sits at $46.30, just below the 161.8% extension of the February crash at $46.76.
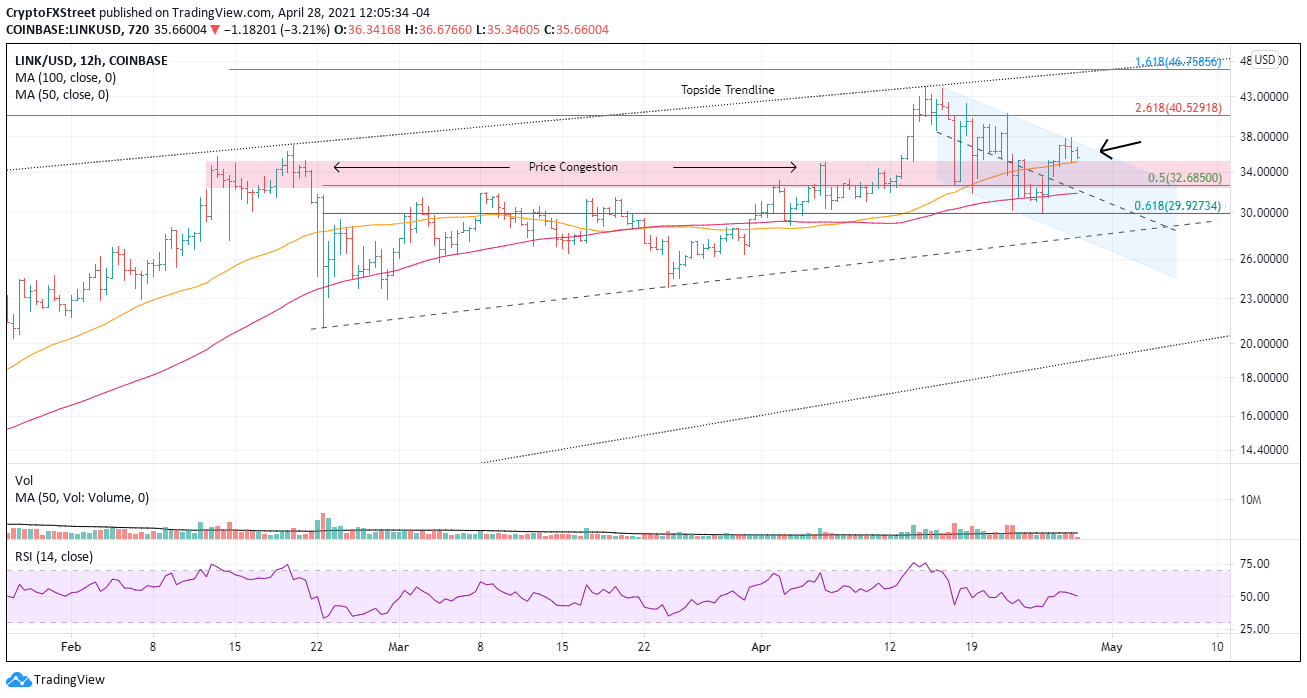
LINK/USD 12-hour chart
With the IOMAP data showing broad support down to $30.38, LINK should not decline beyond the intersection of the 50% retracement of the February crash at $32.68, the channel’s midline at $32.06, and the 100 twelve-hour simple moving average (SMA) at $31.87.
Note: All information on this page is subject to change. The use of this website constitutes acceptance of our user agreement. Please read our privacy policy and legal disclaimer. Opinions expressed at FXstreet.com are those of the individual authors and do not necessarily represent the opinion of FXstreet.com or its management. Risk Disclosure: Trading foreign exchange on margin carries a high level of risk, and may not be suitable for all investors. The high degree of leverage can work against you as well as for you. Before deciding to invest in foreign exchange you should carefully consider your investment objectives, level of experience, and risk appetite. The possibility exists that you could sustain a loss of some or all of your initial investment and therefore you should not invest money that you cannot afford to lose. You should be aware of all the risks associated with foreign exchange trading, and seek advice from an independent financial advisor if you have any doubts.
Recommended Content
Editors’ Picks

Litecoin Price Prediction: LTC tries to retake $100 resistance as miners halt sell-off
Litecoin price grazed 105 mark on Monday, rebounding 22% from the one-month low of $87 recorded during last week’s market crash. On-chain data shows sell pressure among LTC miners has subsided. Is the bottom in?

Bitcoin fails to recover as Metaplanet buys the dip
Bitcoin price struggles around $95,000 after erasing gains from Friday’s relief rally over the weekend. Bitcoin’s weekly price chart posts the first major decline since President-elect Donald Trump’s win in November.

SEC Commissioner Hester Pierce sheds light on Ethereum ETF staking under new administration
In a Friday interview with Coinage, SEC Commissioner Hester Peirce discussed her optimism about upcoming regulatory changes as the agency transitions to new leadership under President Trump’s pick for new Chair, Paul Atkins.

Bitcoin dives 3% from its recent all-time high, is this the cycle top?
Bitcoin investors panicked after the Fed's hawkish rate cut decision, hitting the market with high selling pressure. Bitcoin's four-year market cycle pattern indicates that the recent correction could be temporary.
Bitcoin: 2025 outlook brightens on expectations of US pro-crypto policy
Bitcoin price has surged more than 140% in 2024, reaching the $100K milestone in early December. The rally was driven by the launch of Bitcoin Spot ETFs in January and the reduced supply following the fourth halving event in April.

Best Forex Brokers with Low Spreads
VERIFIED Low spreads are crucial for reducing trading costs. Explore top Forex brokers offering competitive spreads and high leverage. Compare options for EUR/USD, GBP/USD, USD/JPY, and Gold.