Chainlink price ready to reverse, 30% upswing likely for LINK
- Chainlink price is reversing its downtrend and is eyeing a higher high to solidify the bullish thesis.
- On-chain metrics suggest that LINK is in a place of accumulation, adding a tailwind to the rally.
- A breakdown of the $21.35 support level will invalidate the optimistic outlook.
-637336005550289133_XtraLarge.jpg)
Chainlink price seems ready for a reversal of its two-week downswing as it attempts to create a higher high. This outlook is also supported by on-chain metrics, which suggest the possibility of accumulation at the current levels for LINK.
Chainlink price to kick-start a rally
Chainlink price has dropped roughly 41% over the past 18 days, creating a swing low at $22.65, which could potentially be the reversal point. From this pivot point, LINK has rallied 14% to where it currently trades - $25.93.
Investors can expect Chainlink price to continue its upswing toward the 50% retracement level at $30.51. This run-up will represent a 17% ascent and in some cases, the uptrend could extend to the 62% Fibonacci retracement level at $32.40. This move, however, would indicate a 30% upswing for LINK.
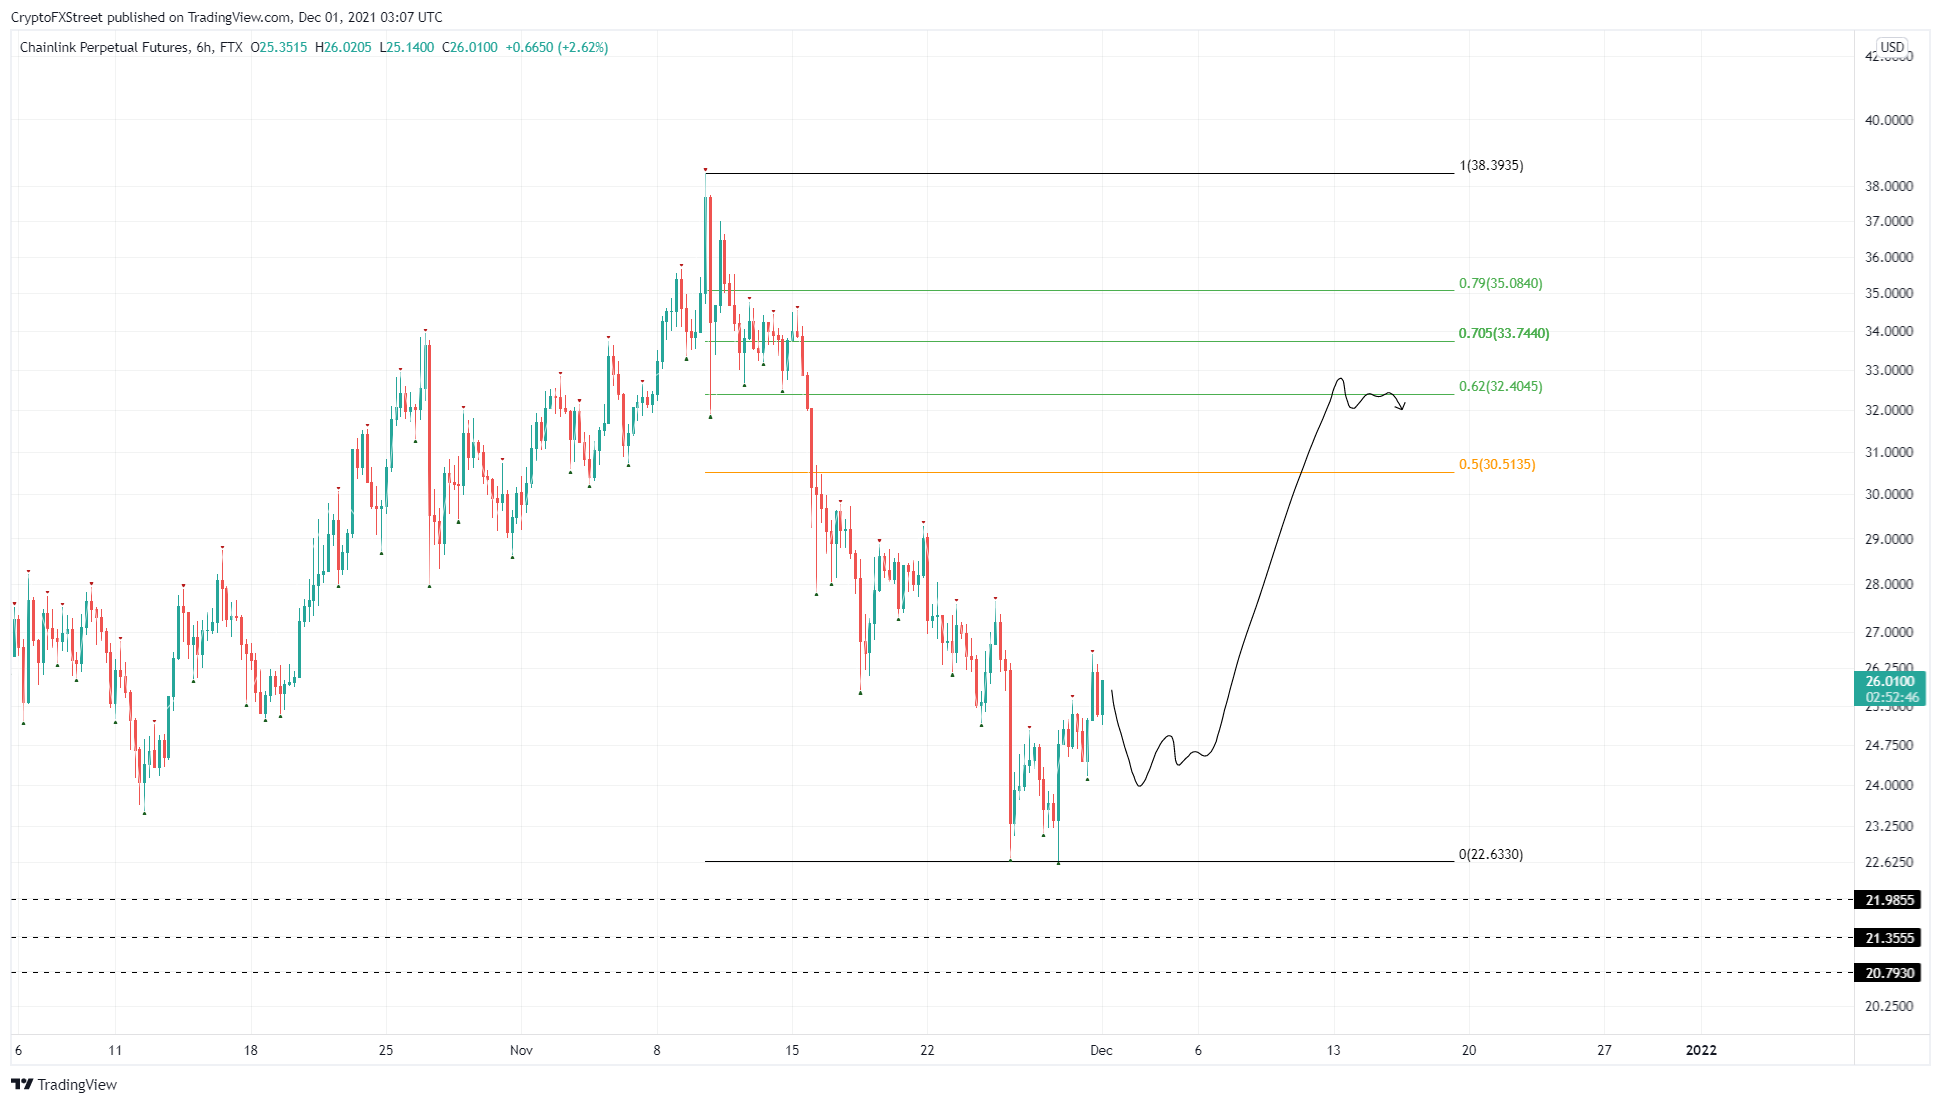
LINK/USDT 6-hour chart
The technicals are clearly indicating a bullish outlook for the oracle token and the Market Value to Realized Value (MVRV) model also suggests a similar outcome as it hovers around -11.5%.
This on-chain metric is used to determine the average profit/loss of investors that purchased LINK over the past month. A negative value indicates that the short-term investors are in the red and this is where long-term holders tend to accumulate.
Therefore, market participants can expect Chainlink price to see a bullish reaction and trigger an upswing.
 [08.37.07, 01 Dec, 2021]-637739322015173859.png)
LINK MVRV 30-day chart
On a similar note, IntoTheBlock’s Global In/Out of the Money (GIOM) model shows that Chainlink price has a free path up to roughly $30. Here, nearly 85,000 addresses purchased 117.45 million LINK tokens.
Therefore, these underwater investors might offload their holdings if the LINK price rises to their breakeven levels. Hence, market participants need to pay close attention to $30.
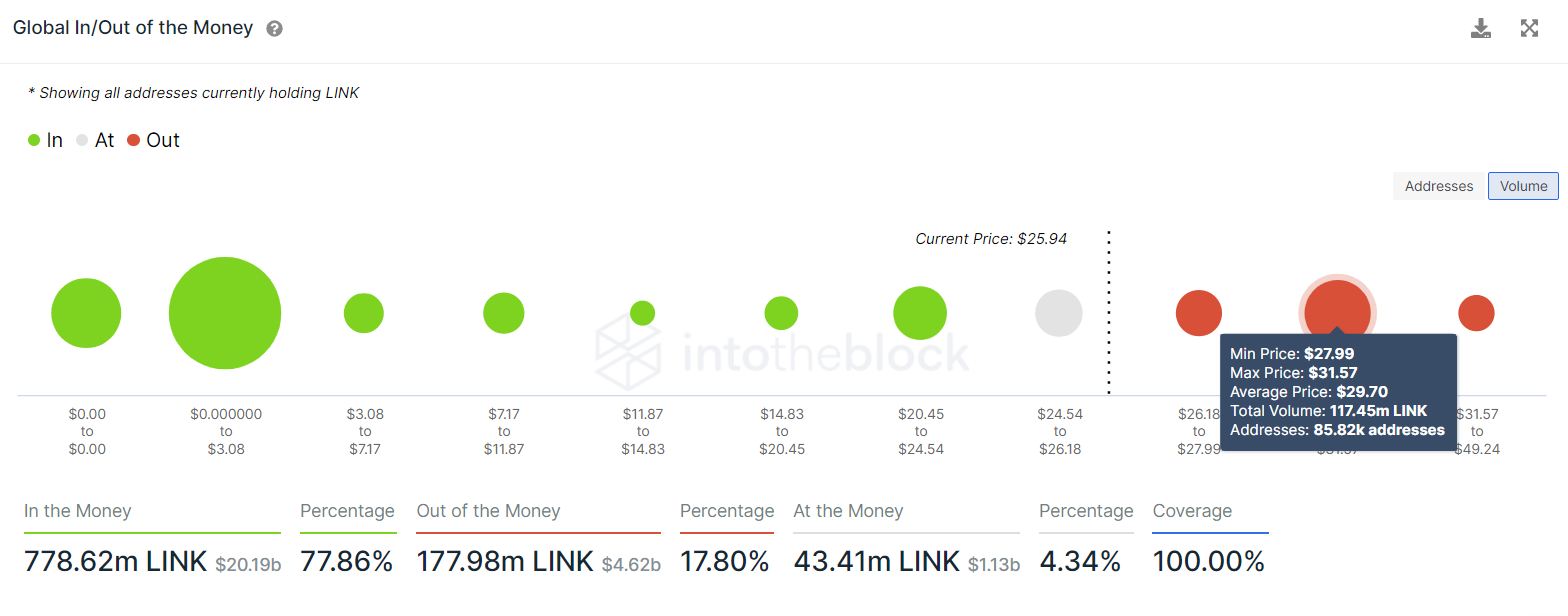
LINK GIOM chart
Regardless of the bullish outlook from both technical and on-chain perspectives, there is a chance Chainlink price might head below the range low at $22.63 to collect liquidity. This move will invalidate the bullish thesis if LINK produces a lower low below $21.35.
In such a scenario, Chainlink price could head lower to retest an immediate support level at $20.79.
Author

Akash Girimath
FXStreet
Akash Girimath is a Mechanical Engineer interested in the chaos of the financial markets. Trying to make sense of this convoluted yet fascinating space, he switched his engineering job to become a crypto reporter and analyst.


