![]() Sheldon McIntyre, CMT
Sheldon McIntyre, CMT
Independent Analyst
- Chainlink price lays a bear trap, rallies 19% over the last four days.
- LINK 2018 uptrend remains active after successful tests on July 20 and 21.
- May’s descending trend line muddles today’s attempt to build on the new rally.
Chainlink price is up 6% this week and carries a 16% loss for July, despite the four-day rally of almost 20%. Today’s attempt to breakout from May’s descending trend line is being subverted by LINK investors capitalizing on the rebound to cut or liquidate positions. How the cryptocurrency closes today will have ramifications for the outlook moving forward.
Chainlink price has not reached a secure position to release the bulls
The Chainlink price gain of nearly 20% over the last four days marks the best return over a four-day period since the beginning of June, pointing to some impulsiveness behind the LINK rebound. Diminishing the importance of the bounce is the weak underlying volume, with only July 21 showing above-average volume.
Moving forward, to encourage the bullish LINK speculators and forecasts, Chainlink price needs to record a daily close above May’s descending trend line, currently at $16.27. It would be the first confirmation of the rally from the support granted by the dominant 2018 ascending trendline on July 20 and 21.
Assuming a bullish close, Chainlink price will face no opposition until the 50-day simple moving average (SMA) at $19.42, followed by the 2020 high of $20.00 and then the July 7 high of $21.27, generating a 30% return from the May descending trend line. A break above $21.27 would also trigger a larger double bottom pattern framed by the June 22 low of $15.00 and the July 20 low of $13.38.
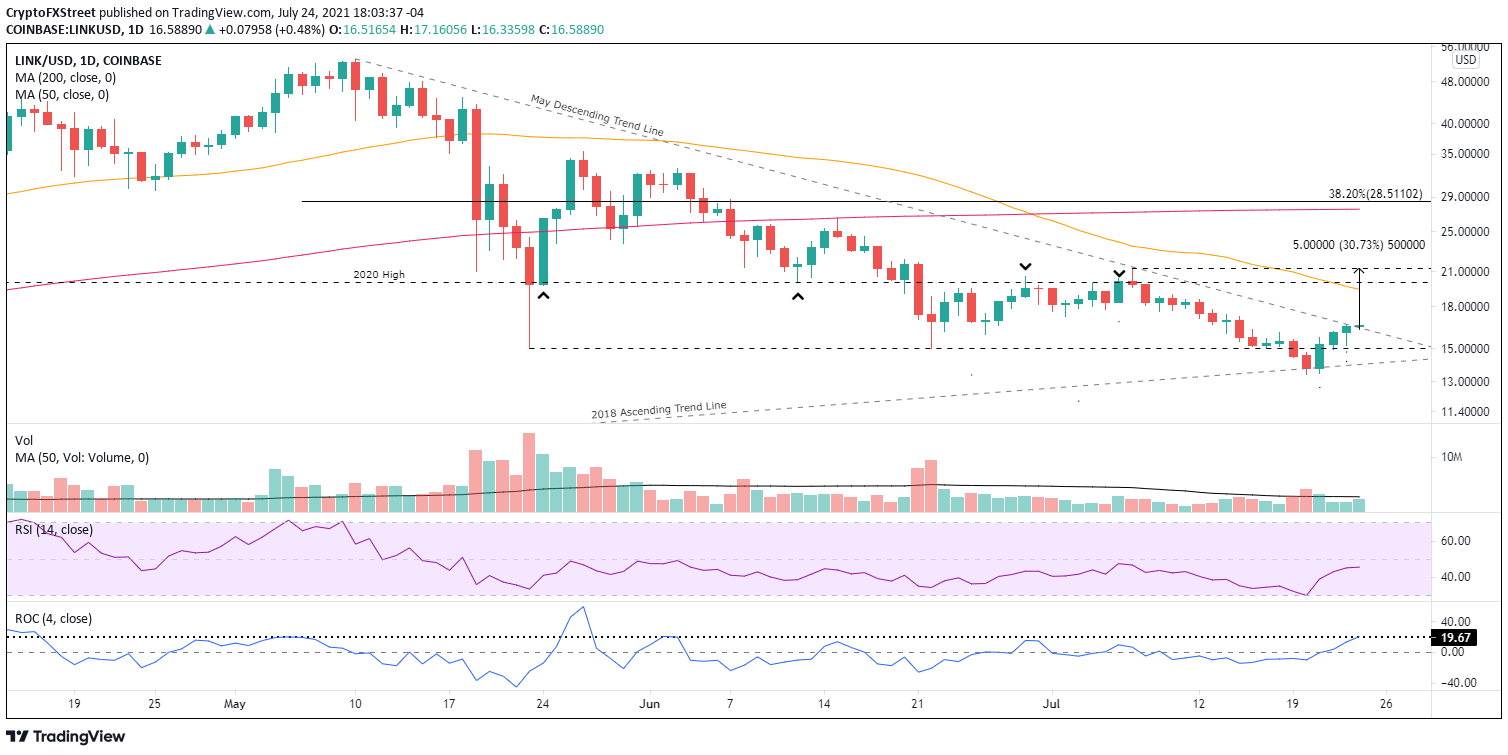
LINK/USD daily chart
Downside support begins with the May 23 and June 22 lows at $15.00, followed by the 2018 ascending trend line, currently at $14.06. A failure to hold the trend line places Chainlink price in a complicated situation with no recognizable support until the December 2020 low of $8.72. An extremely bearish outcome for LINK, but a low probability.
Chainlink price laid the perfect bear trap, using a small gap between the presiding support at $15.00 and the secondary support at the 2018 ascending trendline to mislead the weak holders, proving the inherent value of studying longer timeframes.
Despite the bounce from the bear trap, LINK has not accomplished anything from a macro perspective. It is well below the 50-week SMA at $21.22 and the 200-day SMA at $27.55, writing a challenging story for Chainlink price if a sustainable bid emerges.
For the moment, be a spectator, let Chainlink price prove itself by closing above the May descending trend line and then proceed to accumulate a position with an eye on the LINK price targets discussed above. However, do not overlook the influential support levels if weakness emerges.
Here, FXStreet's analysts evaluate where LINK could be heading next as on-chain metrics turn bullish.
Note: All information on this page is subject to change. The use of this website constitutes acceptance of our user agreement. Please read our privacy policy and legal disclaimer. Opinions expressed at FXstreet.com are those of the individual authors and do not necessarily represent the opinion of FXstreet.com or its management. Risk Disclosure: Trading foreign exchange on margin carries a high level of risk, and may not be suitable for all investors. The high degree of leverage can work against you as well as for you. Before deciding to invest in foreign exchange you should carefully consider your investment objectives, level of experience, and risk appetite. The possibility exists that you could sustain a loss of some or all of your initial investment and therefore you should not invest money that you cannot afford to lose. You should be aware of all the risks associated with foreign exchange trading, and seek advice from an independent financial advisor if you have any doubts.
Recommended Content
Editors’ Picks

Bitcoin Weekly Forecast: BTC nosedives below $95,000 as spot ETFs record highest daily outflow since launch
Bitcoin price continues to edge down, trading below $95,000 on Friday after declining more than 9% this week. Bitcoin US spot ETFs recorded the highest single-day outflow on Thursday since their launch in January.

Bitcoin crashes to $96,000, altcoins bleed: Top trades for sidelined buyers
Bitcoin (BTC) slipped under the $100,000 milestone and touched the $96,000 level briefly on Friday, a sharp decline that has also hit hard prices of other altcoins and particularly meme coins.

Solana Price Forecast: SOL’s technical outlook and on-chain metrics hint at a double-digit correction
Solana (SOL) price trades in red below $194 on Friday after declining more than 13% this week. The recent downturn has led to $38 million in total liquidations, with over $33 million coming from long positions.

SEC approves Hashdex and Franklin Templeton's combined Bitcoin and Ethereum crypto index ETFs
The SEC approved Hashdex's proposal for a crypto index ETF. The ETF currently features Bitcoin and Ethereum, with possible additions in the future. The agency also approved Franklin Templeton's amendment to its Cboe BZX for a crypto index ETF.

Bitcoin: 2025 outlook brightens on expectations of US pro-crypto policy
Bitcoin price has surged more than 140% in 2024, reaching the $100K milestone in early December. The rally was driven by the launch of Bitcoin Spot ETFs in January and the reduced supply following the fourth halving event in April.

Best Forex Brokers with Low Spreads
VERIFIED Low spreads are crucial for reducing trading costs. Explore top Forex brokers offering competitive spreads and high leverage. Compare options for EUR/USD, GBP/USD, USD/JPY, and Gold.