Chainlink Price Prediction: LINK to continue range-bound moves
- Chainlink price is recovering after tapping the lower boundary of a rising wedge pattern.
- The supply and demand zone formed suggests LINK could move sideways.
- A breakdown of 78.6% Fibonacci retracement at $30.6 could trigger a 13% correction to $26.64.
-637336005550289133_XtraLarge.jpg)
Chainlink price shows a swift recovery after the recent drop, with more hurdles on its way. Hence, LINK could experience sideways price action for quite some time.
Chainlink price constricts as significant barriers evolve
Chainlink price crashed nearly 35% during the market-wide sell-off but has recovered almost 25% since then. This upward trajectory will face headwinds due to the supply zone that extends from $38.52 to $44.3.
Interestingly, the supply zone’s upper boundary also coincides with the Momentum Reversal Indicator’s (MRI) breakout line, making it a tough level to crack.
Although unlikely in the short term, breaching this confluence might trigger sidelined investors to jump on the LINK bandwagon to boost its price by 60%. Such a move would propel Chainlink price toward a new all-time high at $70.06, coinciding with the 127.2% Fibonacci extension.
The scenario mentioned above will occur during times of excessive buying pressure. If the buyers fail to pile up, Chainlink price will most likely be stuck trading between the supply and the demand zone.
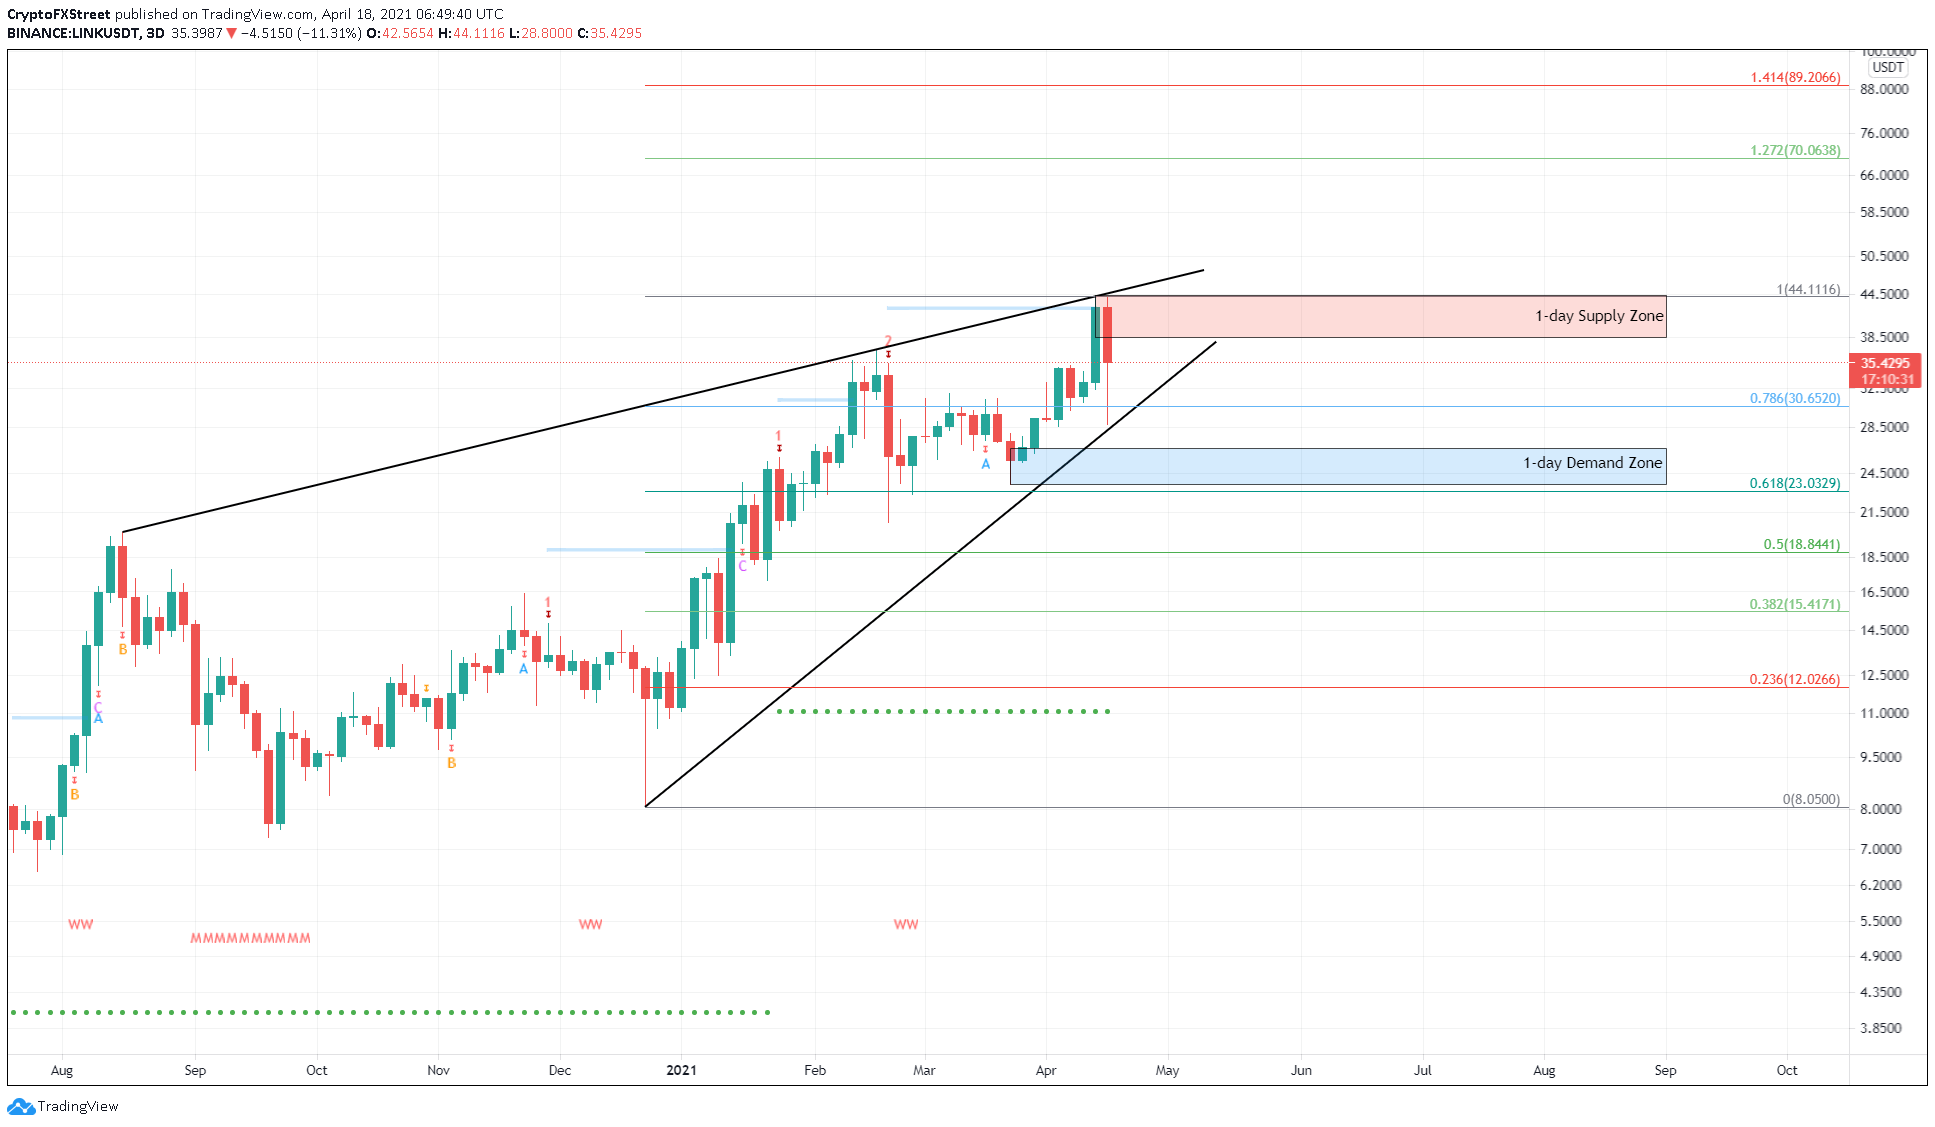
LINK/USDT 3-day chart
If Chainlink price slices through $30.6, it will signal a breakout from the rising wedge pattern. In such a scenario, investors can initially expect a 13% drop toward the upper boundary of the demand zone at $26.64.
Invalidation of the bullish thesis will arrive upon the breakdown of $23.6. This move could further invite panicking investors to crash LINK price by 20% toward the 50% Fibonacci retracement level at $18.8.
Author

Akash Girimath
FXStreet
Akash Girimath is a Mechanical Engineer interested in the chaos of the financial markets. Trying to make sense of this convoluted yet fascinating space, he switched his engineering job to become a crypto reporter and analyst.


