- Chainlink price has skyrocketed by a whopping 70% in the last ten days to hit a new all-time high of $51.30.
- Following the milestone, multiple sell signals have emerged, suggesting an incoming spike in profit-taking.
- Transaction history shows that the $32.80-$43.70 level represents a massive support wall.
Chainlink price has enjoyed an impressive bull rally over the past week that has seen it rise to new all-time highs. Now, a particular technical index shows that investors may be inclined to realized profits.
Chainlink price looks primed to retrace
Chainlink has seen its market value rise by more than 70%. In the past ten days, the decentralized oracles token has gained over 20 points. It went from a low of $29.80 on April 25 to a new all-time high of $51.30 recently.
Despite the significant gains incurred within such a short period, the Tom DeMark (TD) Sequential indicator suggests LINK is bound for a correction.
This technical index presented a sell signal on Chainlink’s daily chart. The bearish formation developed as a green nine candlestick anticipating a one to four daily candlesticks correction before the uptrend resumes. A red two candlestick trading below a preceding red one candle could serve as confirmation that Chainlink price is poised to decline further.
A glimpse at the decentralized oracles token’s daily chart reveals that the TD setup has been incredibly accurate at anticipating local tops on this altcoin’s trend. The four sell signals that this indicator has presented since December 2020 were all validated, resulting in significant retracements.
Therefore, the current pessimistic forecast must be taken seriously even though substantial price discovery is still happening around Chainlink.
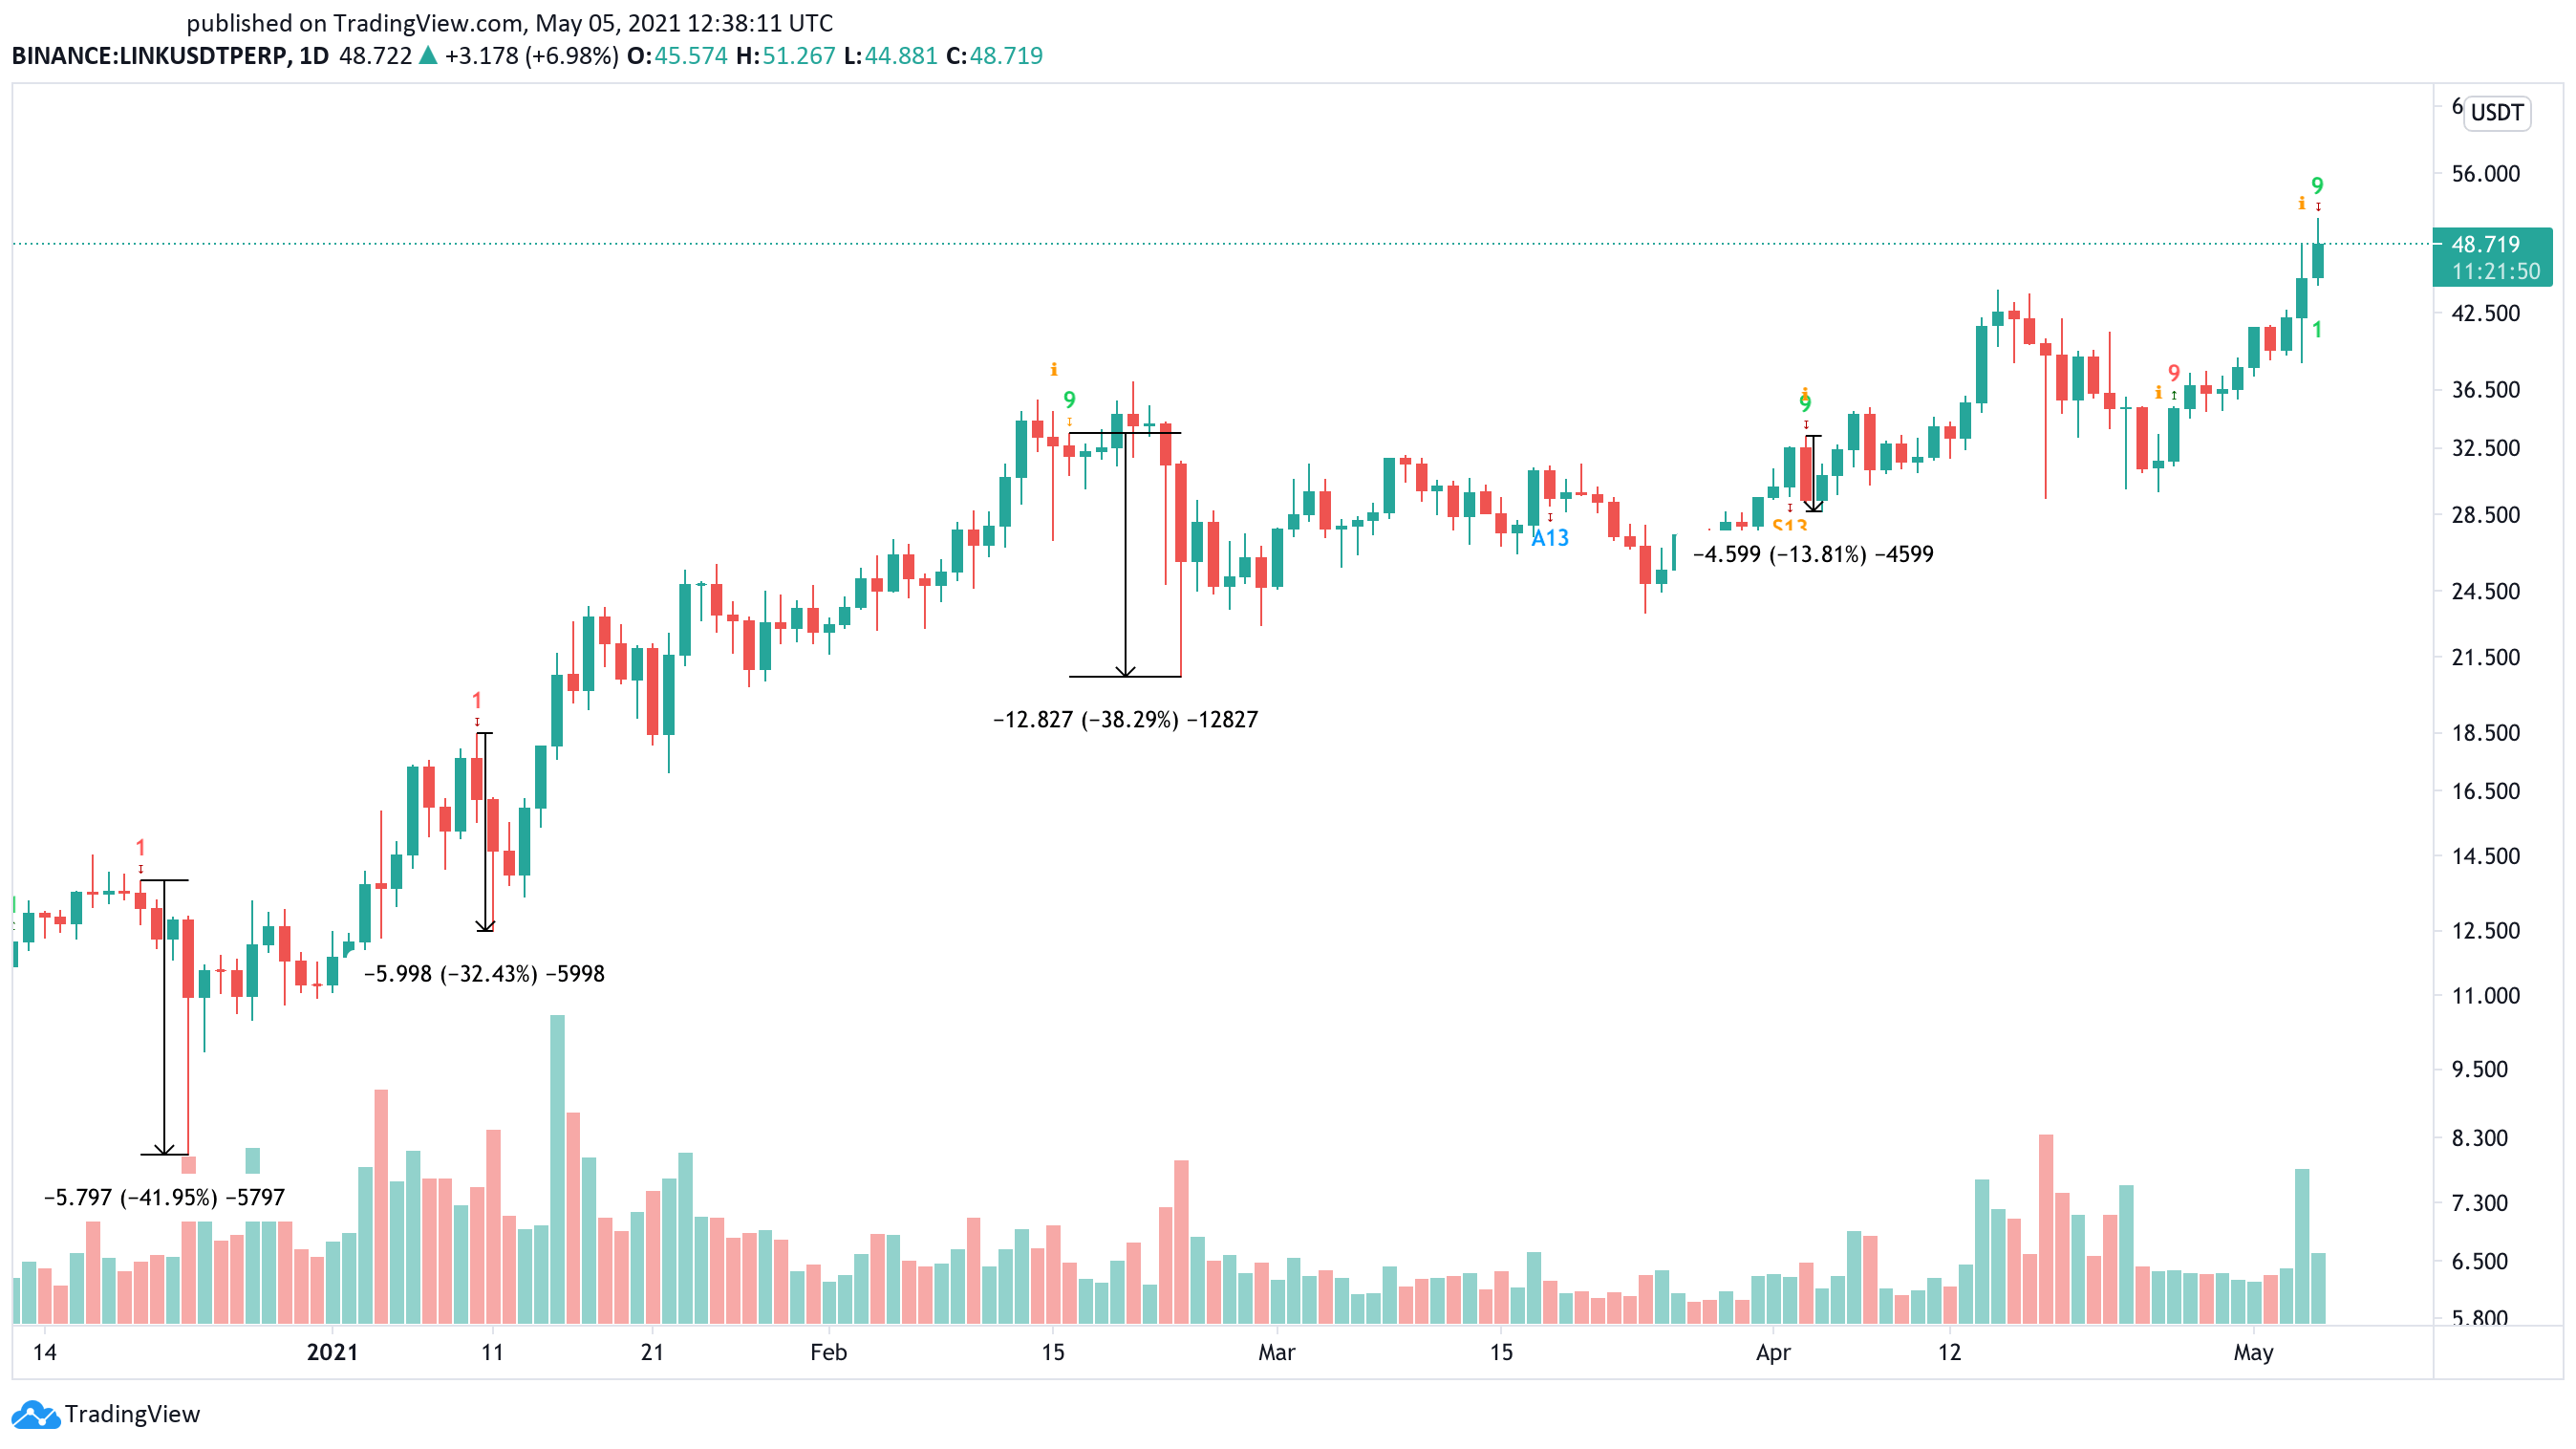
LINK/USDt 1-day chart
IntoTheBlock’s “Global In/Out of the Money” (GIOM) model estimates that the $32.80-$43.70 plays a crucial role in Chainlink’s trend.
Transaction history shows that this is the most significant demand barrier underneath the decentralized oracles token that could hold falling prices at bay. Here, over 76,400 addresses had previously purchased more than 64.25 million LINK. This area could absorb some of the selling pressure from a fall, preventing Chainlink price from falling further.
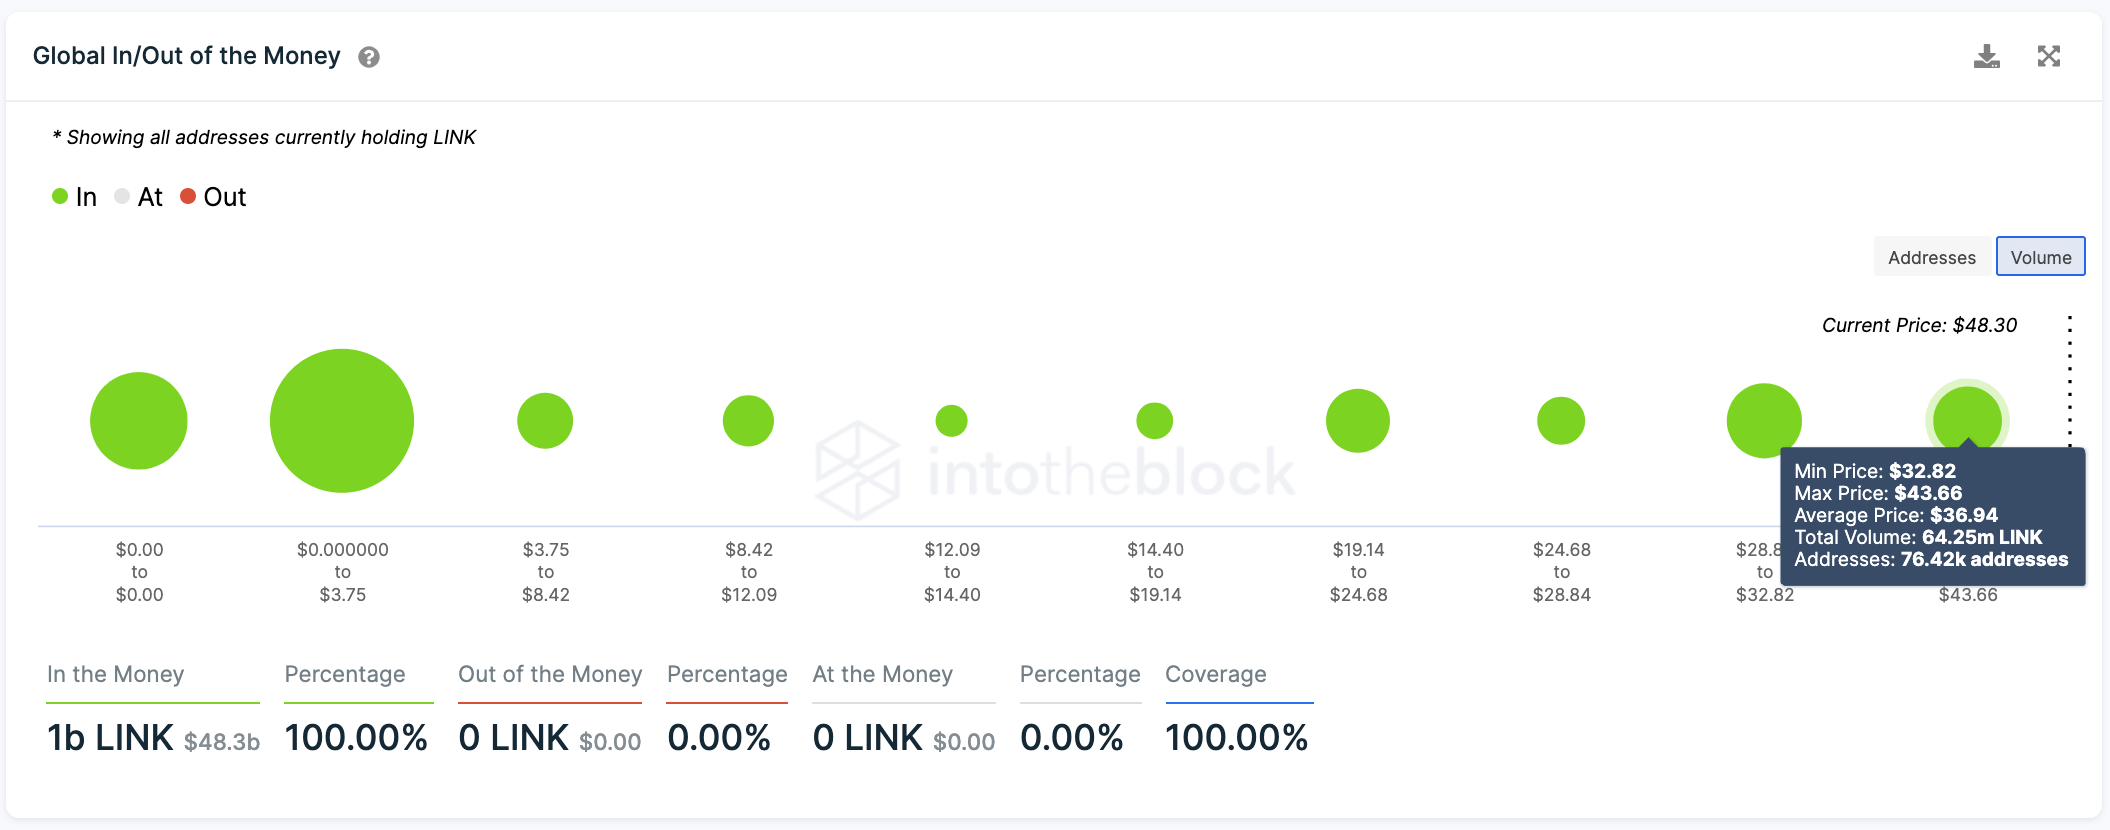
GIOM chart
That said, if this support level breaks, then it could be catastrophic for those betting on the upside. The GIOM cohorts show that the next significant supply level reinforcing Chainlink’s uptrend sits around $30.
If the $36.90 support were to break, LINK holders should expect their investments to plunge by another 17%.
Information on these pages contains forward-looking statements that involve risks and uncertainties. Markets and instruments profiled on this page are for informational purposes only and should not in any way come across as a recommendation to buy or sell in these assets. You should do your own thorough research before making any investment decisions. FXStreet does not in any way guarantee that this information is free from mistakes, errors, or material misstatements. It also does not guarantee that this information is of a timely nature. Investing in Open Markets involves a great deal of risk, including the loss of all or a portion of your investment, as well as emotional distress. All risks, losses and costs associated with investing, including total loss of principal, are your responsibility. The views and opinions expressed in this article are those of the authors and do not necessarily reflect the official policy or position of FXStreet nor its advertisers. The author will not be held responsible for information that is found at the end of links posted on this page.
If not otherwise explicitly mentioned in the body of the article, at the time of writing, the author has no position in any stock mentioned in this article and no business relationship with any company mentioned. The author has not received compensation for writing this article, other than from FXStreet.
FXStreet and the author do not provide personalized recommendations. The author makes no representations as to the accuracy, completeness, or suitability of this information. FXStreet and the author will not be liable for any errors, omissions or any losses, injuries or damages arising from this information and its display or use. Errors and omissions excepted.
The author and FXStreet are not registered investment advisors and nothing in this article is intended to be investment advice.
Recommended Content
Editors’ Picks

Bitcoin Weekly Forecast: BTC nosedives below $95,000 as spot ETFs record highest daily outflow since launch
Bitcoin price continues to edge down, trading below $95,000 on Friday after declining more than 9% this week. Bitcoin US spot ETFs recorded the highest single-day outflow on Thursday since their launch in January.

Bitcoin crashes to $96,000, altcoins bleed: Top trades for sidelined buyers
Bitcoin (BTC) slipped under the $100,000 milestone and touched the $96,000 level briefly on Friday, a sharp decline that has also hit hard prices of other altcoins and particularly meme coins.

Solana Price Forecast: SOL’s technical outlook and on-chain metrics hint at a double-digit correction
Solana (SOL) price trades in red below $194 on Friday after declining more than 13% this week. The recent downturn has led to $38 million in total liquidations, with over $33 million coming from long positions.

SEC approves Hashdex and Franklin Templeton's combined Bitcoin and Ethereum crypto index ETFs
The SEC approved Hashdex's proposal for a crypto index ETF. The ETF currently features Bitcoin and Ethereum, with possible additions in the future. The agency also approved Franklin Templeton's amendment to its Cboe BZX for a crypto index ETF.

Bitcoin: 2025 outlook brightens on expectations of US pro-crypto policy
Bitcoin price has surged more than 140% in 2024, reaching the $100K milestone in early December. The rally was driven by the launch of Bitcoin Spot ETFs in January and the reduced supply following the fourth halving event in April.

Best Forex Brokers with Low Spreads
VERIFIED Low spreads are crucial for reducing trading costs. Explore top Forex brokers offering competitive spreads and high leverage. Compare options for EUR/USD, GBP/USD, USD/JPY, and Gold.