- Chainlink price is hovering above the $23.71 support level, hinting at a potential rally.
- A bounce off the said demand barrier might push LINK up by 11% to 26.47.
- If the $22.06 foothold is breached, it will invalidate the bullish thesis.
Chainlink price is hovering above a crucial support level and could witness a minor upswing before a firm directional bias establishes itself.
Chainlink price at make or break point
Chainlink price has been sliding off the support levels since hitting a local top of $30.59 on August 16. In total, LINK has dropped roughly 21% to where it currently stands, $24.15.
Considering the unstable nature of the big crypto, Chainlink price could continue heading lower or undergo a minor upswing before the actual trend is set up.
Since LINK is heading toward a crucial support level at $23.71 and has a chance at forming a triple bottom, investors can assume the buying pressure will spike, pushing the altcoin up by 11%. The bulls need to slice through the 50% Fibonacci retracement level at $25.18 and tag the $26.47 resistance level to achieve this lift.
If the big crypto and the altcoins turn bullish, market participants can expect this uptrend to continue to the next barrier at $30.72. This move constitutes a nearly 30% upswing from the $23.71 support barrier.
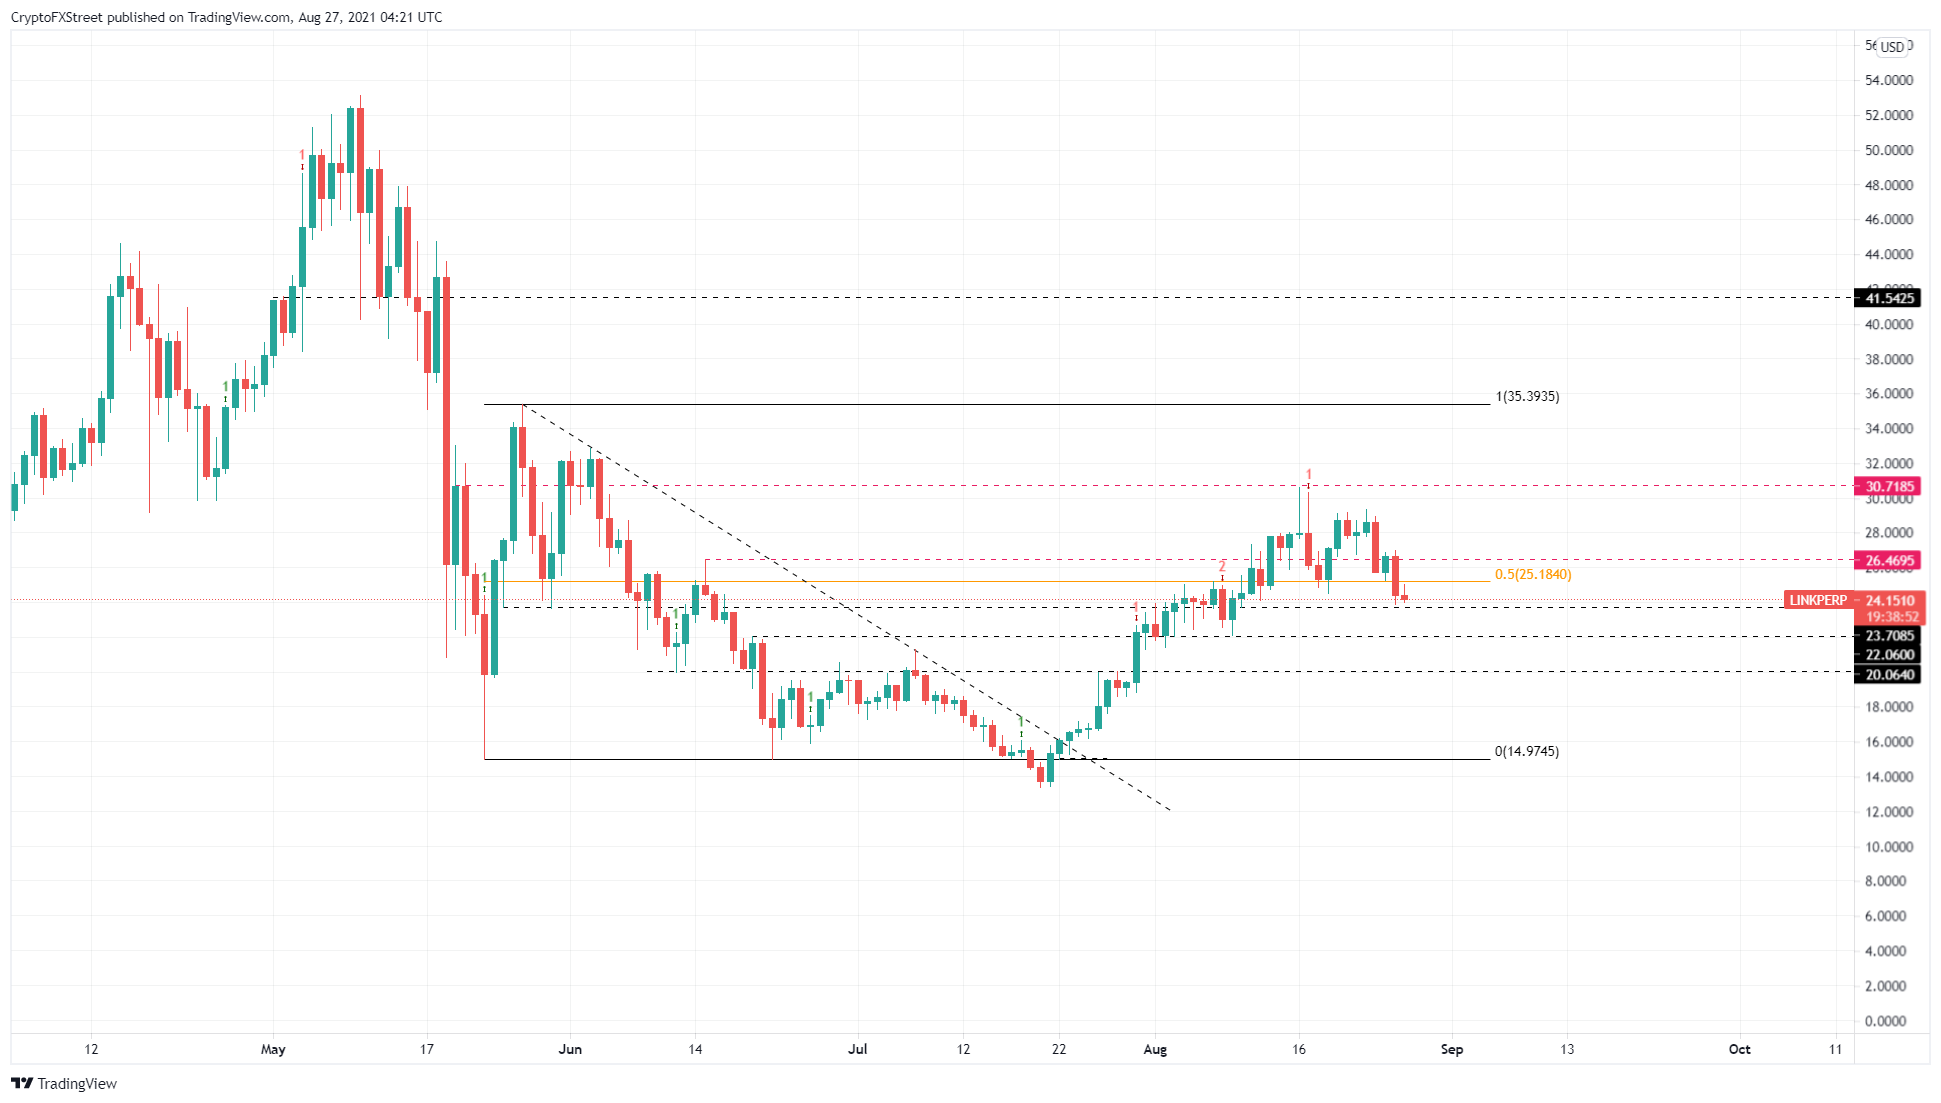
LINK/USDT 1-day chart
While this narrative of a rally seems likely, a failure to bounce off the $23.71 demand level will indicate an extension of the downswing. The foothold at $22.06 is the next barrier that will try to absorb the buying pressure and trigger an upswing.
However, if the buyers fail to make a comeback and Chainlink price produces a decisive daily candlestick close below $22.06, it will invalidate the bullish thesis by setting up a lower low.
If the selling pressure continues to build up, the $20.06 support floor might be tagged.
Information on these pages contains forward-looking statements that involve risks and uncertainties. Markets and instruments profiled on this page are for informational purposes only and should not in any way come across as a recommendation to buy or sell in these assets. You should do your own thorough research before making any investment decisions. FXStreet does not in any way guarantee that this information is free from mistakes, errors, or material misstatements. It also does not guarantee that this information is of a timely nature. Investing in Open Markets involves a great deal of risk, including the loss of all or a portion of your investment, as well as emotional distress. All risks, losses and costs associated with investing, including total loss of principal, are your responsibility. The views and opinions expressed in this article are those of the authors and do not necessarily reflect the official policy or position of FXStreet nor its advertisers. The author will not be held responsible for information that is found at the end of links posted on this page.
If not otherwise explicitly mentioned in the body of the article, at the time of writing, the author has no position in any stock mentioned in this article and no business relationship with any company mentioned. The author has not received compensation for writing this article, other than from FXStreet.
FXStreet and the author do not provide personalized recommendations. The author makes no representations as to the accuracy, completeness, or suitability of this information. FXStreet and the author will not be liable for any errors, omissions or any losses, injuries or damages arising from this information and its display or use. Errors and omissions excepted.
The author and FXStreet are not registered investment advisors and nothing in this article is intended to be investment advice.
Recommended Content
Editors’ Picks
Ripple on-chain metrics show bullish signs amidst legal struggle with SEC, XRP eyes recovery
Ripple made a comeback above $0.48 on Tuesday and hovers above that level in Wednesday’s European session. Ripple on-chain metrics such as transaction volume and Network Realized Profit/Loss have turned bullish, supporting a recovery in the altcoin.
Bitcoin price falls amidst German government transfers, miners activity
Bitcoin (BTC) extends correction on Wednesday and hovers around $61,000 after finding resistance near the $64,000 level on Monday. Recent on-chain data indicates heightened selling activity from Bitcoin miners early in the week.
Crypto Today: Bitcoin erases gains from end of June, Ethereum declines while Ripple holds
Bitcoin wipes out gains from the last week of June and falls below $60,000 on Wednesday. Ethereum and top altcoins ranked by market capitalization erased gains as the inflation outlook worsened. Ripple holds on to recent gains and hovers above $0.48 on Wednesday.
Three reasons why altcoins could shake off losses this week
On-chain data from Santiment shows that altcoins are currently in the opportunity zone, or generating buy signals. The top three altcoins in the buy zone are Basic Attention Token (BAT), Chromia (CHR), and Highstreet (HIGH), per Santiment.
Bitcoin: BTC price correction could end in July, according to seasonal data
Bitcoin (BTC) price appears poised for a decline this week, influenced by slight outflows in US spot ETFs, selling activity among BTC miners, and a combined transfer of 4,690.28 BTC to centralized exchanges by the US and German governments.