Chainlink price likely to rally 25% as LINK continues to trend upward
- Chainlink price is bouncing off $25.92, the trading range’s midpoint, suggesting more upside.
- LINK will likely face a formidable resistance barrier at $33.62, where its gains will be capped.
- A breakdown of the $18.64 support level will invalidate the bullish thesis.
-637336005550289133_XtraLarge.jpg)
Chainlink price reveals that it wants to continue heading higher, making sense from a technical perspective. On-chain metrics also suggest that its path does not harbor significant barriers.
Chainlink price inches closer to its all-time high
Chainlink price has been trading between a range, stretching from $13.38 to $38.46 for nearly six months. The recent downtrend caused LINK to shed 55% from the range high at $38.46. However, this downtrend set the stage for a 65% gain to where the oracle token now trades - $26.72. Going forward, Chainlink price is likely to bounce off the 50% retracement level at $25.92 and embark on a 26% run-up to retest the weekly resistance barrier at $33.62.
Although unlikely, the Chainlink price could swing higher to tag the range high at $38.46.
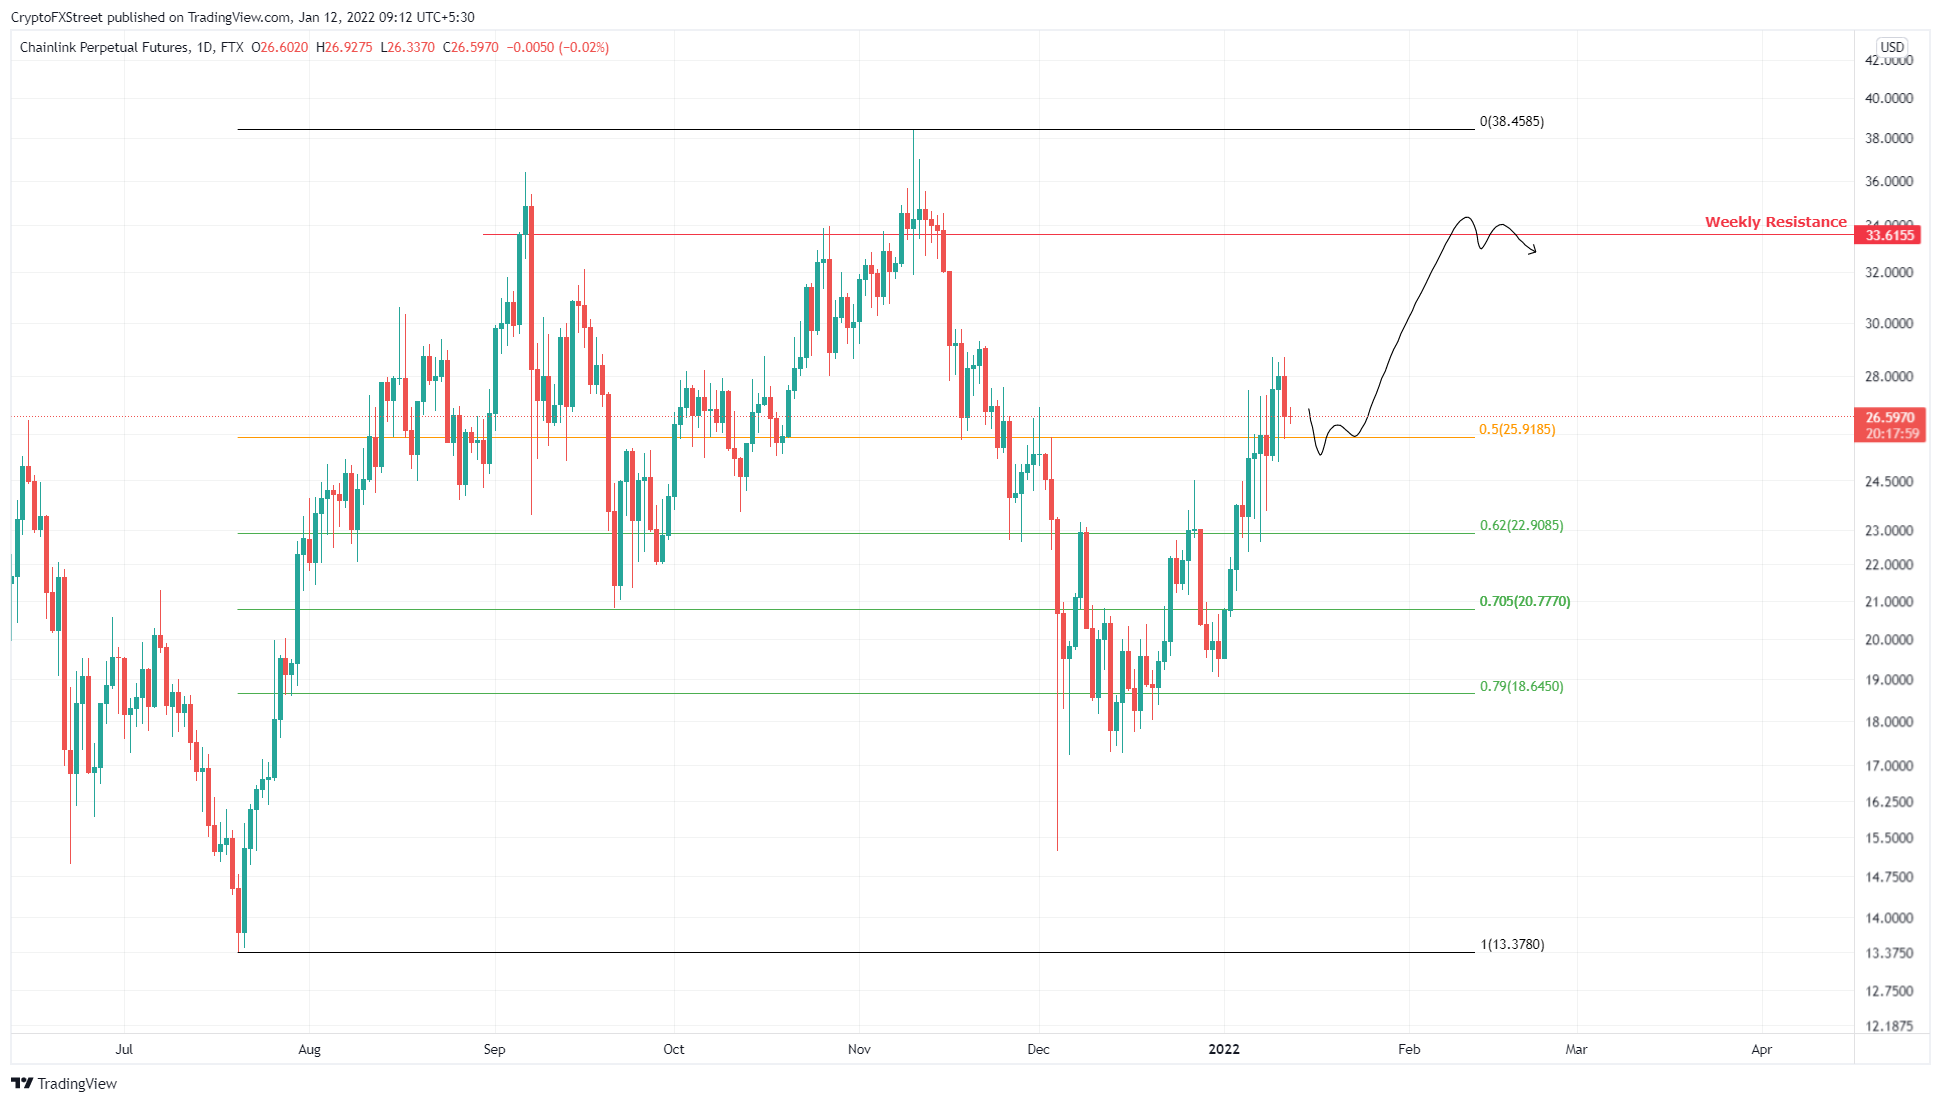
LINK/USDT 4-hour chart
Supporting this uptrend for Chainlink price is IntoTheBlock’s Global In/Out of the Money (GIOM) model. This on-chain index shows little to no resistance barriers plaguing the oracle token’s path.
The only cluster of underwater investors that could pose a minor threat is present at $29.85, where roughly 62,470 addresses that purchased 29.72 million LINK tokens are “Out of the Money.”
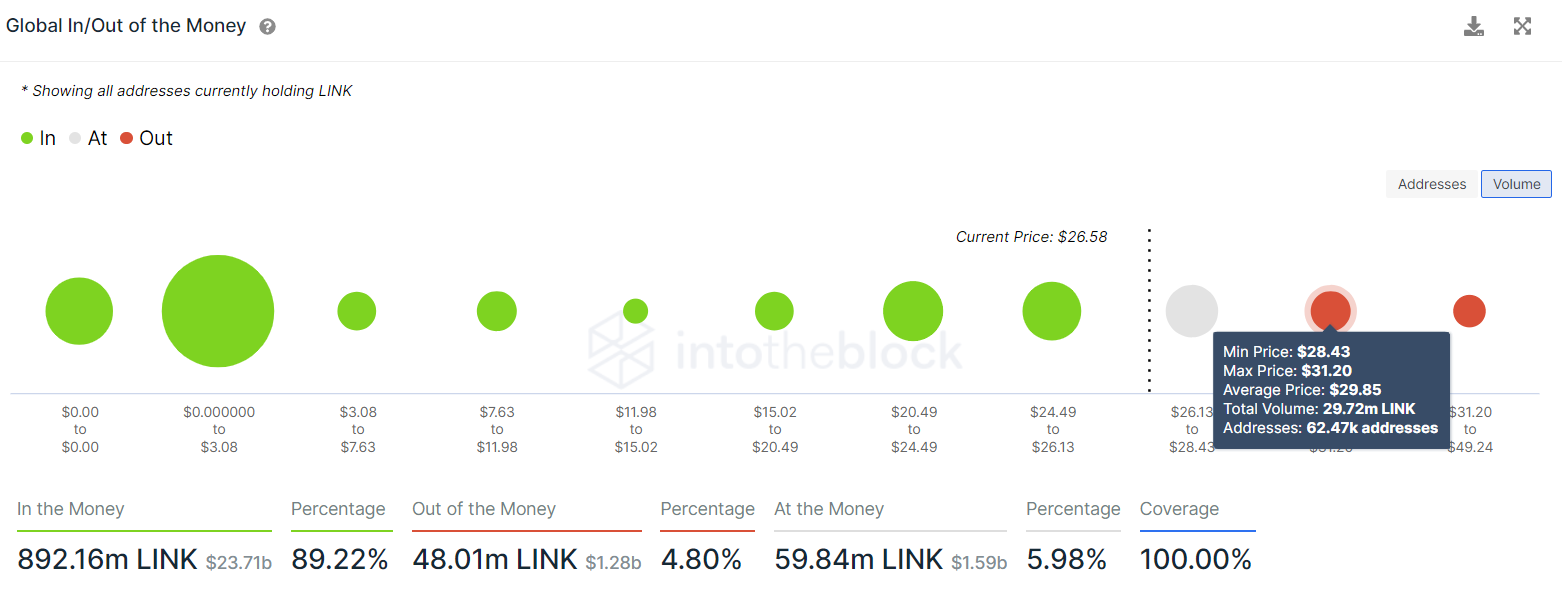
LINK GIOM
Further adding a tailwind to the bullish outlook is the recent uptick in large transactions worth $100,000 or more. Such transfers have increased from 276 to 733 over the past six months.
This 165% surge in large transactions serves as a proxy to the institutional investor sentiment, suggesting a bullish outlook for Chainlink price.
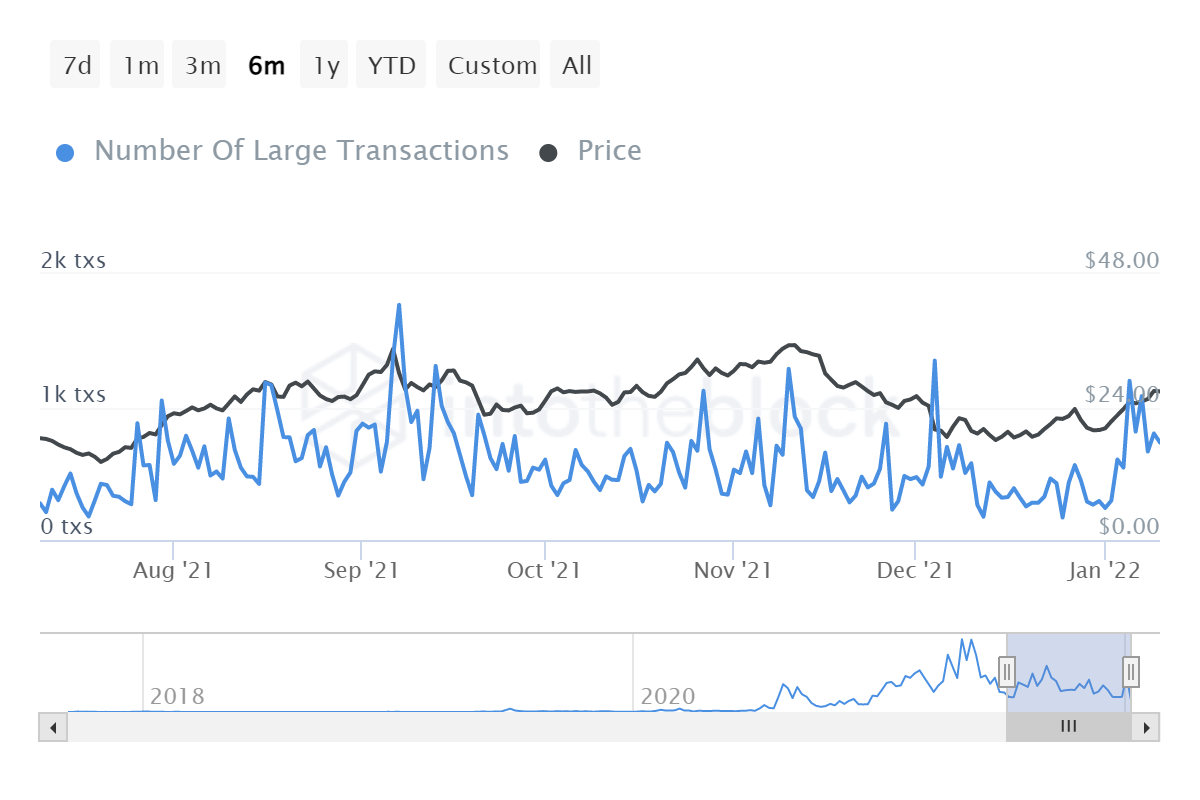
LINK large transactions
While the outlook for Chainlink price is, without a doubt, bullish, a potential spike in selling pressure that knocks it below the midpoint at $25.92 will delay the uptrend.
If this downward pressure builds up, allowing LINK to produce a four-hour candlestick close below $18.65, it will create a lower low, denting the uptrend seen so far. In addition, it will also invalidate the bullish thesis for LINK and potentially open up a path to retest the range low at $13.38.
Author

Akash Girimath
FXStreet
Akash Girimath is a Mechanical Engineer interested in the chaos of the financial markets. Trying to make sense of this convoluted yet fascinating space, he switched his engineering job to become a crypto reporter and analyst.


