![]() Sheldon McIntyre, CMT
Sheldon McIntyre, CMT
Independent Analyst
- Chainlink price reaching outer limit of 9-day returns for 2021.
- Topside trendline looms over rally sustainability.
- IOMAP data shows trivial resistance at current price level.
Chainlink price broke through the descending channel on April 30 after three days of being locked at the intersection of two crucial resistance zones. Demand has not climbed over the last three days, but the developing inside-day illustrates a stalemate between accumulation and distribution, setting the platform for a trend continuation.
Chainlink price sponsor Grayscale, delivers superior returns
The Grayscale Chainlink Trust announced they are up 41.34% since the end of February with $5.8 million assets under management (AUM) in Chainlink (LINK). The trust’s official inception was February 26, joining the lineup of other single asset investment options from Grayscale.
The latest Intotheblock In/Out of the Money Around Price (IOMAP) data reveals meager resistance at current Chainlink price levels with a large cluster of support above the dueling zones of support.
In the range of $35.53 to $36.74, 13.04k addresses purchased 18.73 million LINK with an average price of $36.30. The range sits slightly above the upper limit of the Chainlink price congestion at $35.10, going back to the February high and above the upper trend line of the descending channel at $34.80.
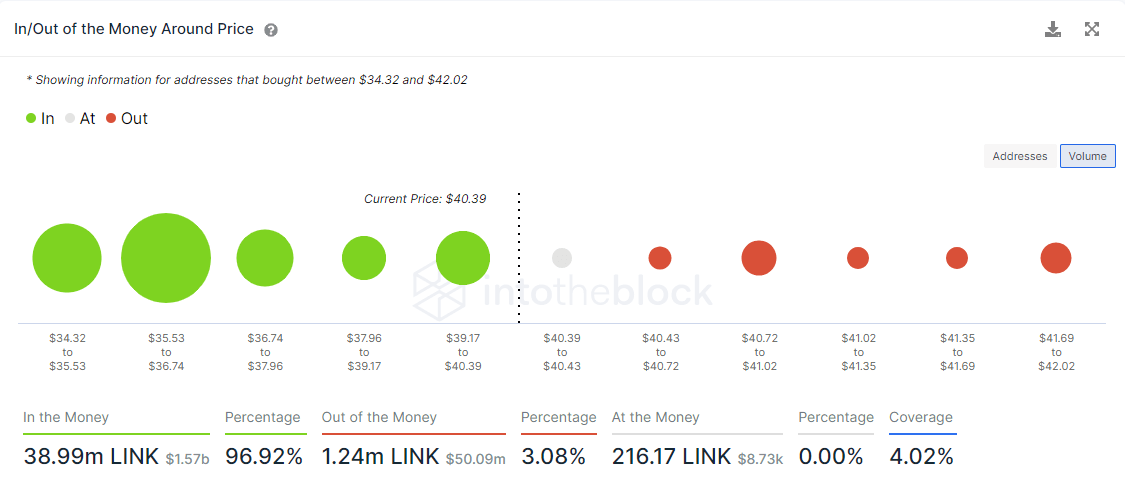
LINK IOMAP data
The breakout of the Chainlink price from the descending channel was a critical development for the altcoin and elevated the prospect of a new all-time high at $44.16. Standing in the way of a sustainable rally is the topside trendline that begins June 2019 and travels through the August 2020 high at $47.08, and the 161.8% Fibonacci extension of the February crash at $46.76.
In the short-term, some consolidation may be necessary considering that the rally since the April 25 low (9-days) has yielded a 28.80% return, pushing Chainlink price to the upper range of 9-day returns going back to the end of January. Each time Chainlink has gained near 30%; there has been a subsequent pause or correction.
Upside targets for Chainlink price begin with the 161.8% extension at $46.76, followed by the topside trendline at $47.08 and then the 361.8% extension of the August-September 2020 correction at $52.36.
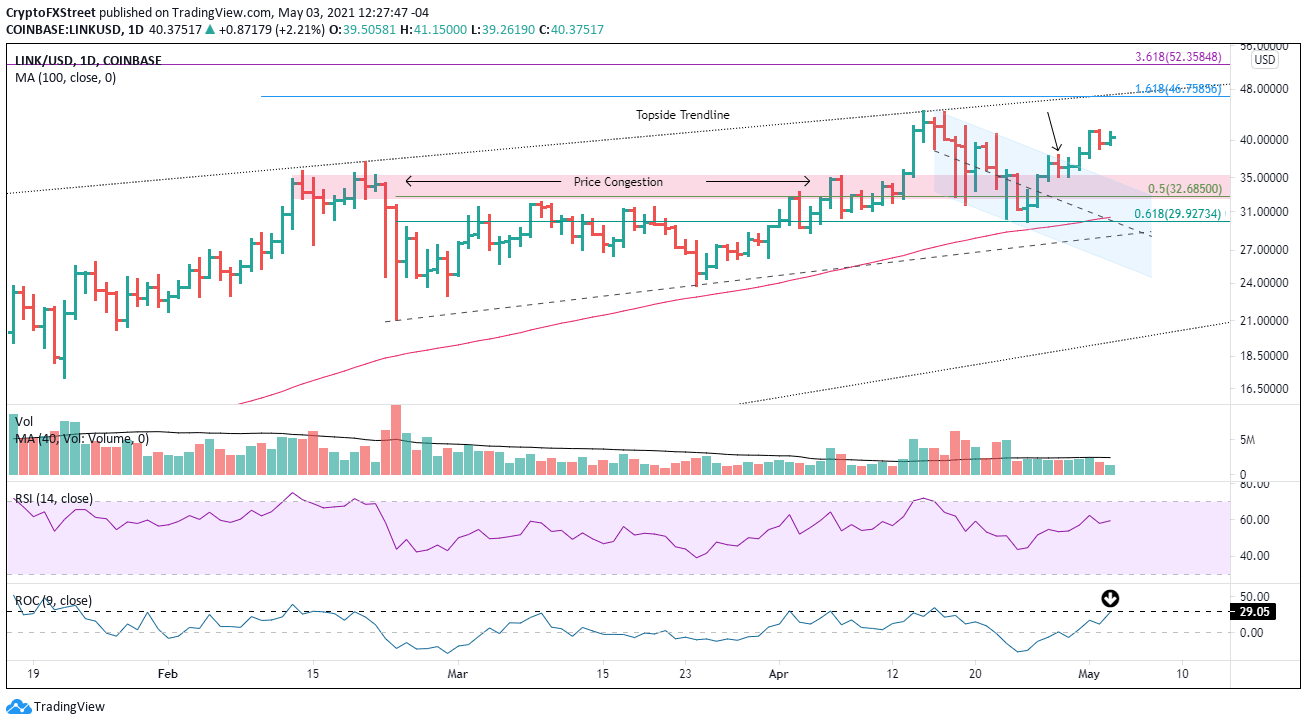
LINK/USD daily chart
The downside for Chainlink price is supported by the congestion marked in red, the descending channel marked in blue, and the 50% retracement of the February-April advance at $32.68.
Note: All information on this page is subject to change. The use of this website constitutes acceptance of our user agreement. Please read our privacy policy and legal disclaimer. Opinions expressed at FXstreet.com are those of the individual authors and do not necessarily represent the opinion of FXstreet.com or its management. Risk Disclosure: Trading foreign exchange on margin carries a high level of risk, and may not be suitable for all investors. The high degree of leverage can work against you as well as for you. Before deciding to invest in foreign exchange you should carefully consider your investment objectives, level of experience, and risk appetite. The possibility exists that you could sustain a loss of some or all of your initial investment and therefore you should not invest money that you cannot afford to lose. You should be aware of all the risks associated with foreign exchange trading, and seek advice from an independent financial advisor if you have any doubts.
Recommended Content
Editors’ Picks

Why LIBRA meme coin promoted by Argentina President Milei is crashing?
LIBRA meme coin promoted by Argentina’s President Javier Milei is making headlines again, crashing nearly 15% on the day. A local Argentine media outlet, Perfil, reported that lawyer Gregorio Dalbón had requested Interpol for a red notice to be issued for Hayden Davis.

Metaverse narrative stalls as price action fades, but on-chain data signals continuing accumulation
Metaverse tokens Sandbox, Decentraland and Axie Infinity continue to face correction since they topped in early December. A Glassnode report suggests that despite price pullback, on-chain activity suggests holders accumulation.

DeFi user loses over $700K USDC in a sandwich attack that experts suggest could be money laundering
A DeFi trader became the subject of discussion among crypto community members on Wednesday after losing more than $700K worth of stablecoins to a sandwich attack on the Uniswap v3 protocol.

Tether on-chain activity surges to a six-month high with 143,000 daily transfers
Tether (USDT) stablecoin on-chain activity has rapidly risen, with over 143,000 daily transfers, surging to a 6-month high. Moreover, the USDT Network growth metric increases, indicating greater blockchain usage.

Bitcoin: Will Trump's Strategic Bitcoin Reserve and White House Crypto Summit support BTC recovery?
Bitcoin price extends its decline on Friday, falling over 5% so far this week. BTC uncertainty and volatility spikes liquidated $1.67 billion as the first-ever White House Crypto Summit takes place on Friday.

The Best brokers to trade EUR/USD
SPONSORED Discover the top brokers for trading EUR/USD in 2025. Our list features brokers with competitive spreads, fast execution, and powerful platforms. Whether you're a beginner or an expert, find the right partner to navigate the dynamic Forex market.