![]() Sheldon McIntyre, CMT
Sheldon McIntyre, CMT
Independent Analyst
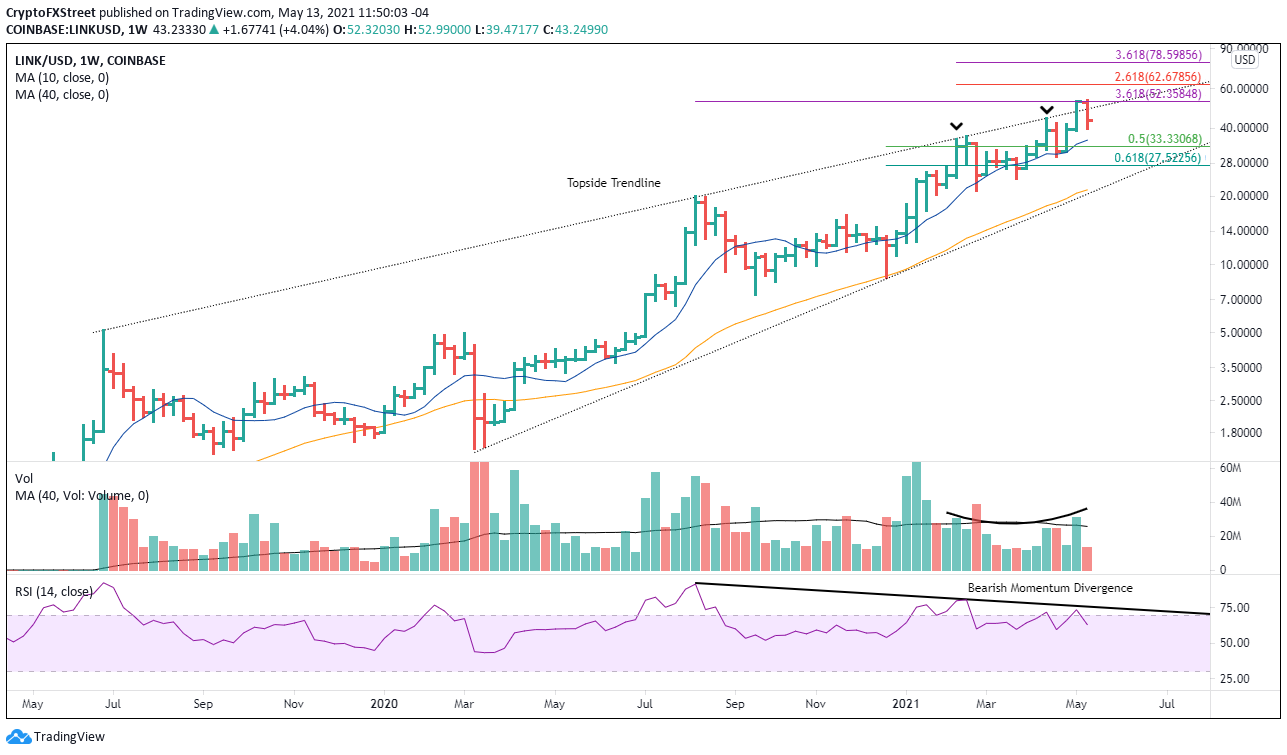
- Chainlink price stumbles for the third time at longstanding topside trend line.
- Bearish momentum divergence on the weekly chart threatens the current rally.
- Weak accumulation/distribution profile undermines rally sustainability.
Chainlink price is at a pivotal point on the charts as it battles the topside trend line originating in 2019. Faltering momentum continues to overshadow the proposals for a decisive rally above the trend line, putting LINK at risk of another correction, potentially deeper than the other two in 2021.
Chainlink price searches for validation amidst conflicting technicals
Fall-off risk is heightened by the sell-off in the cryptocurrency market overnight and the prospect of spillover into today. Chainlink price was already struggling, but the combination of stubborn resistance and broader market weakness raises the probability that it perpetuates the cycle of local tops at the outstanding trend line, as was experienced at the February and April highs.
At the junction of price with the trend line is the 361.8% Fibonacci extension of the last notable decline from August-September 2020 at $52.35. Interestingly, last week’s close was at $52.34, and this week’s high was $52.99, affirming the technical importance of the extension level.
Chainlink price weakness should endure, particularly within the context of broad-based selling. Immediate support accrues at the 10-week simple moving average (SMA) at $35.53, followed closely by the 50% retracement of the rally beginning at the end of 2020 at $33.33. A failure at the 61.8% retracement of $27.52 presents the possibility for a test of the confluence of the 40-week SMA at $21.41 with the rising trend line currently at $20.43, representing a 50% decline from price at the time of writing.
Adding to the bearish outlook is the lingering bearish momentum divergence that arises when the Relative Strength Index (RSI) fails to confirm the Chainlink price and, in this case, the weekly RSI. As well, the weekly volume totals for up weeks have not been flattering since the initial surge in early January, questioning the commitment of traders to support sustained selling pressure.
LINK/USD daily chart
A weekly close above the topside trend line and the 361.8% extension at $52.35 nullifies the bearish prognosis and advances the opportunity for Chainlink price to reach the 261.8% extension of the February decline at $62.68 and then the 361.8% extension of the same decline at $78.60.
Note: All information on this page is subject to change. The use of this website constitutes acceptance of our user agreement. Please read our privacy policy and legal disclaimer. Opinions expressed at FXstreet.com are those of the individual authors and do not necessarily represent the opinion of FXstreet.com or its management. Risk Disclosure: Trading foreign exchange on margin carries a high level of risk, and may not be suitable for all investors. The high degree of leverage can work against you as well as for you. Before deciding to invest in foreign exchange you should carefully consider your investment objectives, level of experience, and risk appetite. The possibility exists that you could sustain a loss of some or all of your initial investment and therefore you should not invest money that you cannot afford to lose. You should be aware of all the risks associated with foreign exchange trading, and seek advice from an independent financial advisor if you have any doubts.
Recommended Content
Editors’ Picks

Bitcoin Weekly Forecast: BTC nosedives below $95,000 as spot ETFs record highest daily outflow since launch
Bitcoin price continues to edge down, trading below $95,000 on Friday after declining more than 9% this week. Bitcoin US spot ETFs recorded the highest single-day outflow on Thursday since their launch in January.

Bitcoin crashes to $96,000, altcoins bleed: Top trades for sidelined buyers
Bitcoin (BTC) slipped under the $100,000 milestone and touched the $96,000 level briefly on Friday, a sharp decline that has also hit hard prices of other altcoins and particularly meme coins.

Solana Price Forecast: SOL’s technical outlook and on-chain metrics hint at a double-digit correction
Solana (SOL) price trades in red below $194 on Friday after declining more than 13% this week. The recent downturn has led to $38 million in total liquidations, with over $33 million coming from long positions.

SEC approves Hashdex and Franklin Templeton's combined Bitcoin and Ethereum crypto index ETFs
The SEC approved Hashdex's proposal for a crypto index ETF. The ETF currently features Bitcoin and Ethereum, with possible additions in the future. The agency also approved Franklin Templeton's amendment to its Cboe BZX for a crypto index ETF.

Bitcoin: 2025 outlook brightens on expectations of US pro-crypto policy
Bitcoin (BTC) price has surged more than 140% in 2024, reaching the $100K milestone in early December. The rally was driven by the launch of Bitcoin Spot Exchange Traded Funds (ETFs) in January and the reduced supply following the fourth halving event in April.

Best Forex Brokers with Low Spreads
VERIFIED Low spreads are crucial for reducing trading costs. Explore top Forex brokers offering competitive spreads and high leverage. Compare options for EUR/USD, GBP/USD, USD/JPY, and Gold.