- Chainlink price is up 50% since mid-June, with signs of a continued uptrend supported by several indicators.
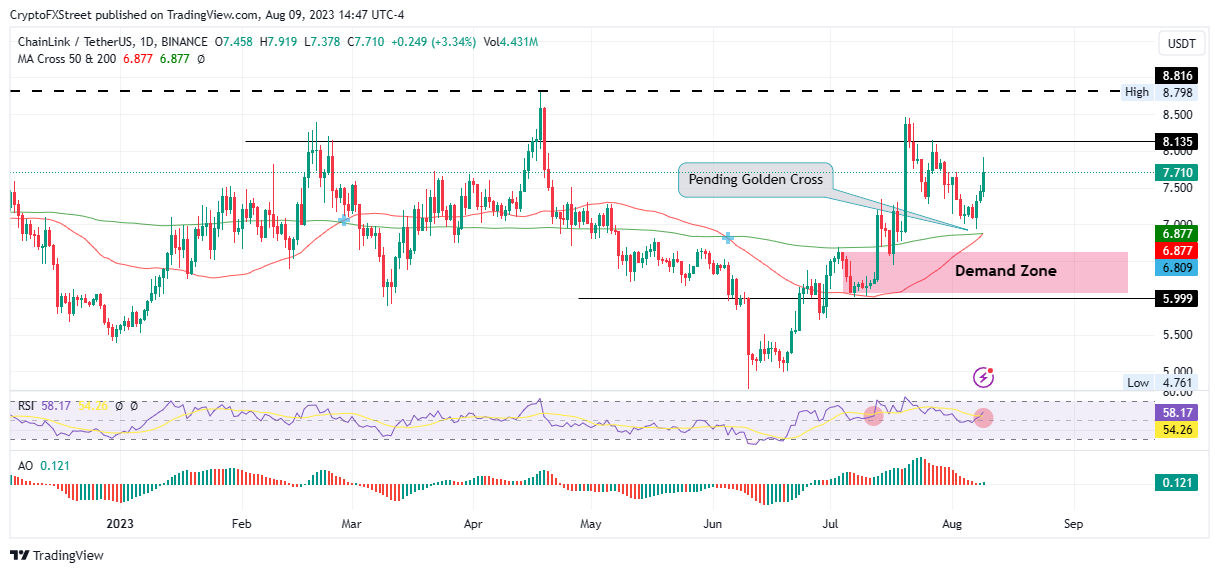
- LINK could rise 15% to breach the $8.816 resistance level if the 50-day MA and 200-day MA execute the pending golden cross.
- The bullish outlook will be invalidated upon a decisive daily candlestick close below the demand zone at $5.999.
Chainlink (LINK) price is one of the biggest gainers over the last three months after a bullish breakout around mid-June. The altcoin remains northbound, with community members hyped around the integration of Chainlink into Coinbase’s Ethereum Layer-2 (L2) solution, Base. As reported, the move will see developers ship applications to Base while powering the development on the L2 chain.
Also Read: Coinbase Layer 2 Base goes live alongside new collaborator, Chainlink
Chainlink price readies for a breakout
Chainlink (LINK) price could be headed north, coiling up for a possible rally to the range high around $8.798. The technical set up is bullish, with a pending golden cross that would be executed once the 50-day Moving Average (MA) crosses above the 200-day MA.
The ensuing demand pressure could see Chainlink price extend north, shattering the $8.135 resistance level before a neck higher to the April 18 high around $8.798. Such a move would constitute a 50% ascension above current levels.
The Relative Strength Index (RSI) also just executed a bullish crossover when it moved above the signal line (yellow) band. The last time this momentum indicator delivered such a move (also backed by sufficient momentum to move the indicator above the midline at 50 toward the 70 level) Chainlink price recorded a 15% climb in one day.
LINK/USDT 1-day chart
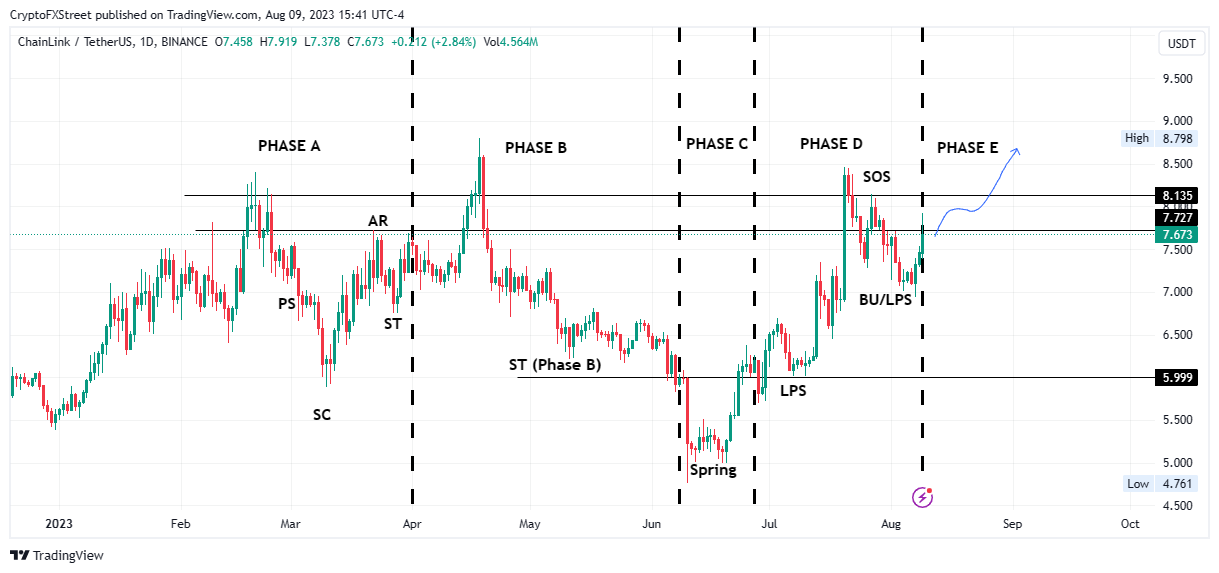
Notably, Chainlink price action also aligns with the first schematic of the Wyckoff Events, which suggests a possible breakout.
Accumulation: Wyckoff Events
Wyckoff’s method attempts to anticipate the market by analyzing supply and demand and studying price action, volume and time.
On-chain metric
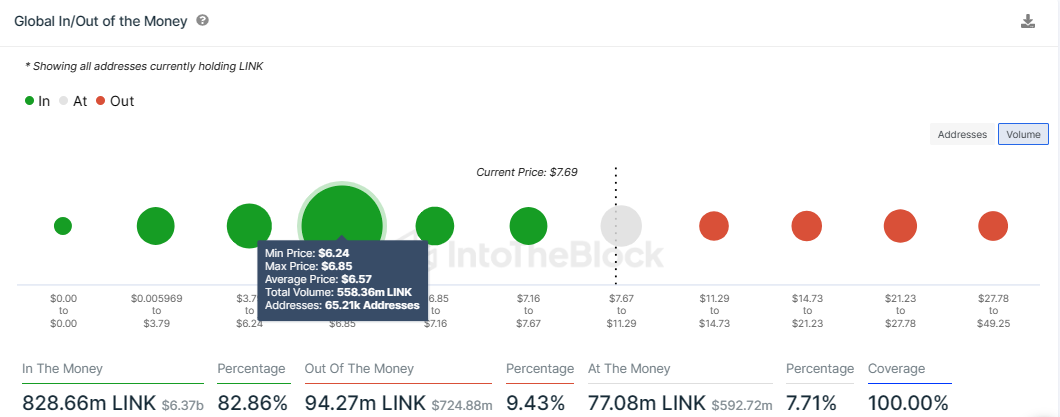
Data from IntoTheBlock’s Global In/Out of the Money (GIOM) supports the bullish outlook, showing Chainlink price had strong support at around the $6.24 to $6.65 range. Any efforts by the bears to push LINK south would be countered by buying pressure, from around 65,210 addresses that bought approximately 558.36 million LINK tokens at an average price of $6.57.
LINK GIOM
The data also shows 828.66 million link holders are currently in profit, against the 94.27 million holders suffering losses.
On the other hand, Chainlink price could drop, possibly, as the sell orders of traders who longed LINK trigger. The ensuing selling pressure could see the altcoin drop toward the demand zone where the possibility of a bounce back to the north would present. If this fails, however, the demand zone, turned bearish breaker, could see Chainlink price extend south, invalidating the bullish outlook at around the $5.999 support level.
Cryptocurrency prices FAQs
How do new token launches or listings affect cryptocurrency prices?
Token launches like Arbitrum’s ARB airdrop and Optimism OP influence demand and adoption among market participants. Listings on crypto exchanges deepen the liquidity for an asset and add new participants to an asset’s network. This is typically bullish for a digital asset.
How do hacks affect cryptocurrency prices?
A hack is an event in which an attacker captures a large volume of the asset from a DeFi bridge or hot wallet of an exchange or any other crypto platform via exploits, bugs or other methods. The exploiter then transfers these tokens out of the exchange platforms to ultimately sell or swap the assets for other cryptocurrencies or stablecoins. Such events often involve an en masse panic triggering a sell-off in the affected assets.
How do macroeconomic releases and events affect cryptocurrency prices?
Macroeconomic events like the US Federal Reserve’s decision on interest rates influence risk assets like Bitcoin, mainly through the direct impact they have on the US Dollar. An increase in interest rate typically negatively influences Bitcoin and altcoin prices, and vice versa. If the US Dollar index declines, risk assets and associated leverage for trading gets cheaper, in turn driving crypto prices higher.
How do major crypto upgrades like halvings, hard forks affect cryptocurrency prices?
Halvings are typically considered bullish events as they slash the block reward in half for miners, constricting the supply of the asset. At consistent demand if the supply reduces, the asset’s price climbs. This has been observed in Bitcoin and Litecoin.
Information on these pages contains forward-looking statements that involve risks and uncertainties. Markets and instruments profiled on this page are for informational purposes only and should not in any way come across as a recommendation to buy or sell in these assets. You should do your own thorough research before making any investment decisions. FXStreet does not in any way guarantee that this information is free from mistakes, errors, or material misstatements. It also does not guarantee that this information is of a timely nature. Investing in Open Markets involves a great deal of risk, including the loss of all or a portion of your investment, as well as emotional distress. All risks, losses and costs associated with investing, including total loss of principal, are your responsibility. The views and opinions expressed in this article are those of the authors and do not necessarily reflect the official policy or position of FXStreet nor its advertisers. The author will not be held responsible for information that is found at the end of links posted on this page.
If not otherwise explicitly mentioned in the body of the article, at the time of writing, the author has no position in any stock mentioned in this article and no business relationship with any company mentioned. The author has not received compensation for writing this article, other than from FXStreet.
FXStreet and the author do not provide personalized recommendations. The author makes no representations as to the accuracy, completeness, or suitability of this information. FXStreet and the author will not be liable for any errors, omissions or any losses, injuries or damages arising from this information and its display or use. Errors and omissions excepted.
The author and FXStreet are not registered investment advisors and nothing in this article is intended to be investment advice.
Recommended Content
Editors’ Picks

Shiba Inu eyes positive returns in April as SHIB price inches towards $0.000015
Shiba Inu's on-chain metrics reveal robust adoption, as addresses with balances surge to 1.4 million. Shiba Inu's returns stand at a solid 14.4% so far in April, poised to snap a three-month bearish trend from earlier this year.

AI tokens TAO, FET, AI16Z surge despite NVIDIA excluding crypto-related projects from its Inception program
AI tokens, including Bittensor and Artificial Superintelligence Alliance, climbed this week, with ai16z still extending gains at the time of writing on Friday. The uptick in prices of AI tokens reflects a broader bullish sentiment across the cryptocurrency market.

Bitcoin Weekly Forecast: BTC consolidates after posting over 10% weekly surge
Bitcoin price is consolidating around $94,000 at the time of writing on Friday, holding onto the recent 10% increase seen earlier this week. This week’s rally was supported by strong institutional demand, as US spot ETFs recorded a total inflow of $2.68 billion until Thursday.

XRP price could renew 25% breakout bid on surging institutional and retail adoption
Ripple price consolidates, trading at $2.18 at the time of writing on Friday, following mid-week gains to $2.30. The rejection from this weekly high led to the price of XRP dropping to the previous day’s low at $2.11, followed by a minor reversal.

Bitcoin Weekly Forecast: BTC consolidates after posting over 10% weekly surge
Bitcoin (BTC) price is consolidating around $94,000 at the time of writing on Friday, holding onto the recent 10% increase seen earlier this week.

The Best brokers to trade EUR/USD
SPONSORED Discover the top brokers for trading EUR/USD in 2025. Our list features brokers with competitive spreads, fast execution, and powerful platforms. Whether you're a beginner or an expert, find the right partner to navigate the dynamic Forex market.


