Chainlink goes full steam ahead and outperforms with 50% gains for 2022
- Chainlink outperforms the majors like Bitcoin and Ethereum with a full-blown rally.
- LINK nears its next profit target at $30 but sees the rally take a breather as the broader cryptocurrency space gets traction.
- With a big bag of supporting elements, the only way is up for Chainlink with a price target set at $40.
-637336005550289133_XtraLarge.jpg)
Chainlink (LINK) has been an outlier for the first ten days of 2022 when most cryptocurrencies were on the back foot, but in the case of Chainlink the altcoin booked a solid 50% gain with an additional 46% of gains to come if the trend sees continuation. As price action takes a breather at $29, new investors will want to mark up a few technical levels to get engaged and enter into a rally that could continue towards $40. With global markets on the front foot today, a turn in sentiment could provide an additional tailwind to the rally and see fresh money coming in.
Chainlink sees sentiment tailwinds added to the momentum
Chainlink defied the laws of physics by being one of the few cryptocurrencies that rallied in a risk-off environment that was subdued by Omicron worries and the FEDs hawkish rate path in 2022. These worries sparked a broad and aggressive sell-off in equities and pushed investors to chop positions in riskier assets. Chainlink advanced with ease, however, and turned a few essential technical levels into support, which now come into play as the rally takes a breather after the Relative Strength Index (RSI) hit the overbought marker.
The first line of defense to uphold the uptrend is the intersection from the green ascending trend line acting as the rally's backbone with the monthly R1 resistance level at or around $26. This will be the first crucial test and window of opportunity for new investors to join the rally. If that does not hold, look for a false breakout with $25 as a supportive historical line and the 200-day Simple Moving Average (SMA) coming in flat around that same level.
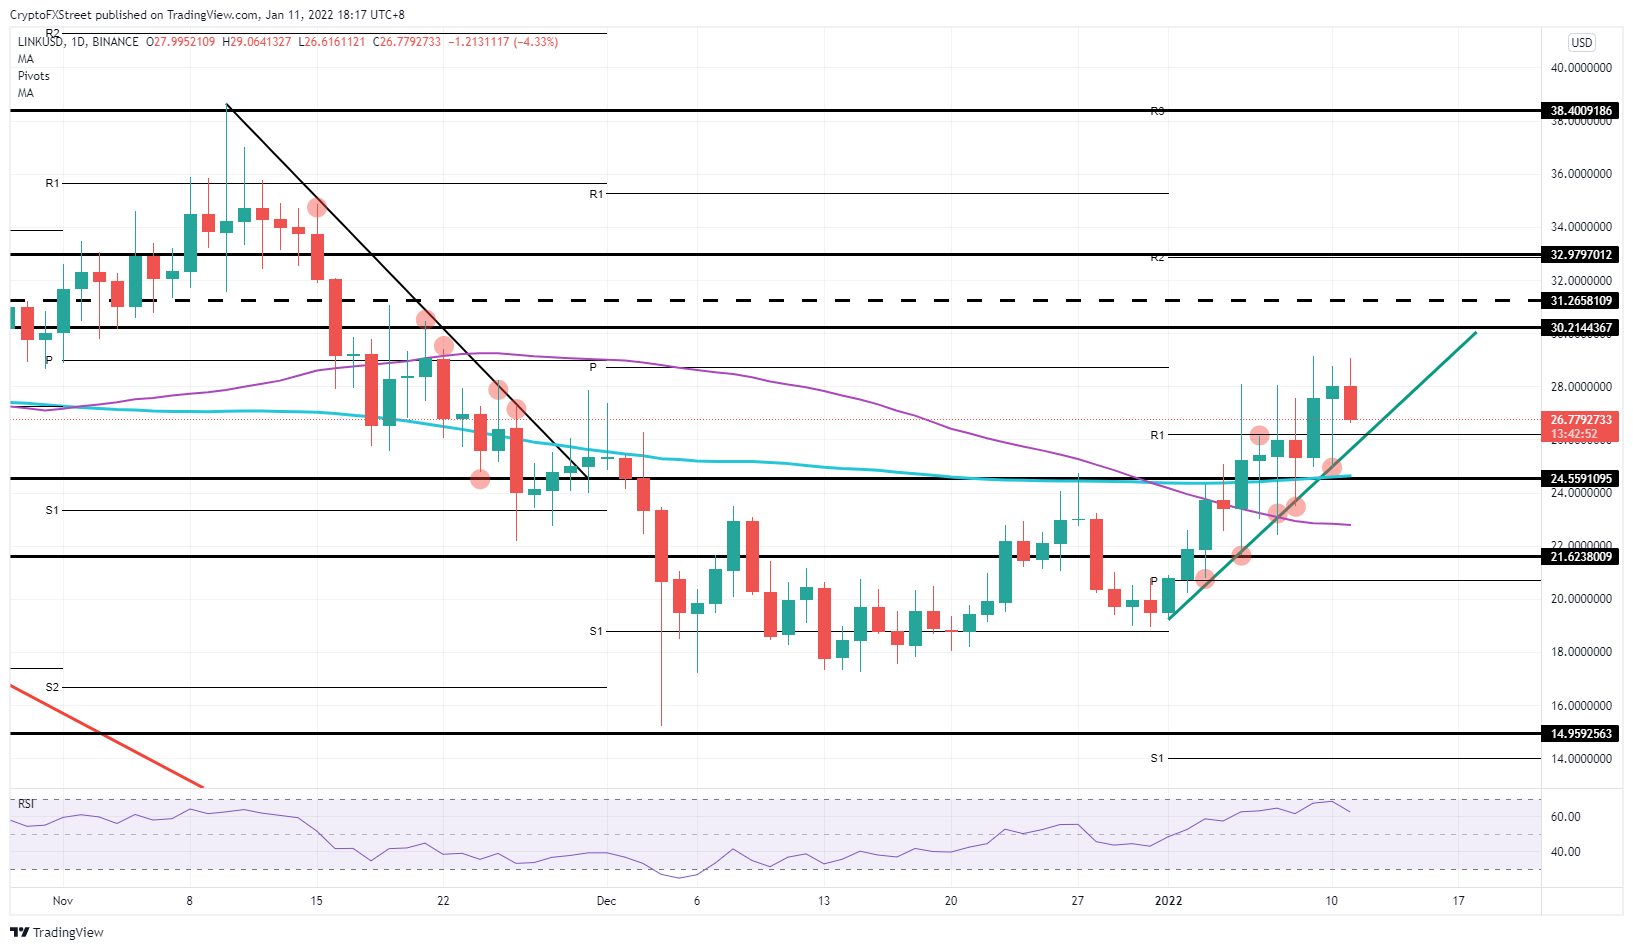
LINK/USD daily chart
If the global market rout returns, expect to see an accelerated move to the downside with the break of the green ascending trend line and the 200-day SMA. The break of that 200-day SMA opens the door towards $21.60, which has already been chopped up in the past few weeks and thus will only slow down the correction but will not be able to stop it entirely. Instead, look for that $15 low from December 04 to provide an endpoint for the downturn.
Author

Filip Lagaart
FXStreet
Filip Lagaart is a former sales/trader with over 15 years of financial markets expertise under its belt.


