- Chainlink price closed the Wednesday session with an impressive 7% gain.
- Bulls attempted to extend the Wednesday rally but were handily rejected by sellers.
- Upside potential remains substantial, while downside risks are more limited.
Chainlink price has experienced some major swing over the past two trading days. Bulls were unable to repeat Wednesday’s performance but, at the same time, kept LINK’s Thursday losses to a minimum. Most importantly, from an Ichimoku perspective, bulls were able to keep the daily close above the Tenkan-Sen and the Kijun-Sen, creating a fantastic base for higher moves.
Chainlink price develops bullish support structure, but follow-through needed to prevent a continued downtrend
Chainlink price completed several major bullish events on Wednesday’s close. Wednesday’s close confirmed a breakout above the falling wedge as well as the Tenkan-Sen and Kijun-Sen. But the price action and resistance zones ahead could be choppy, despite the bullish close.
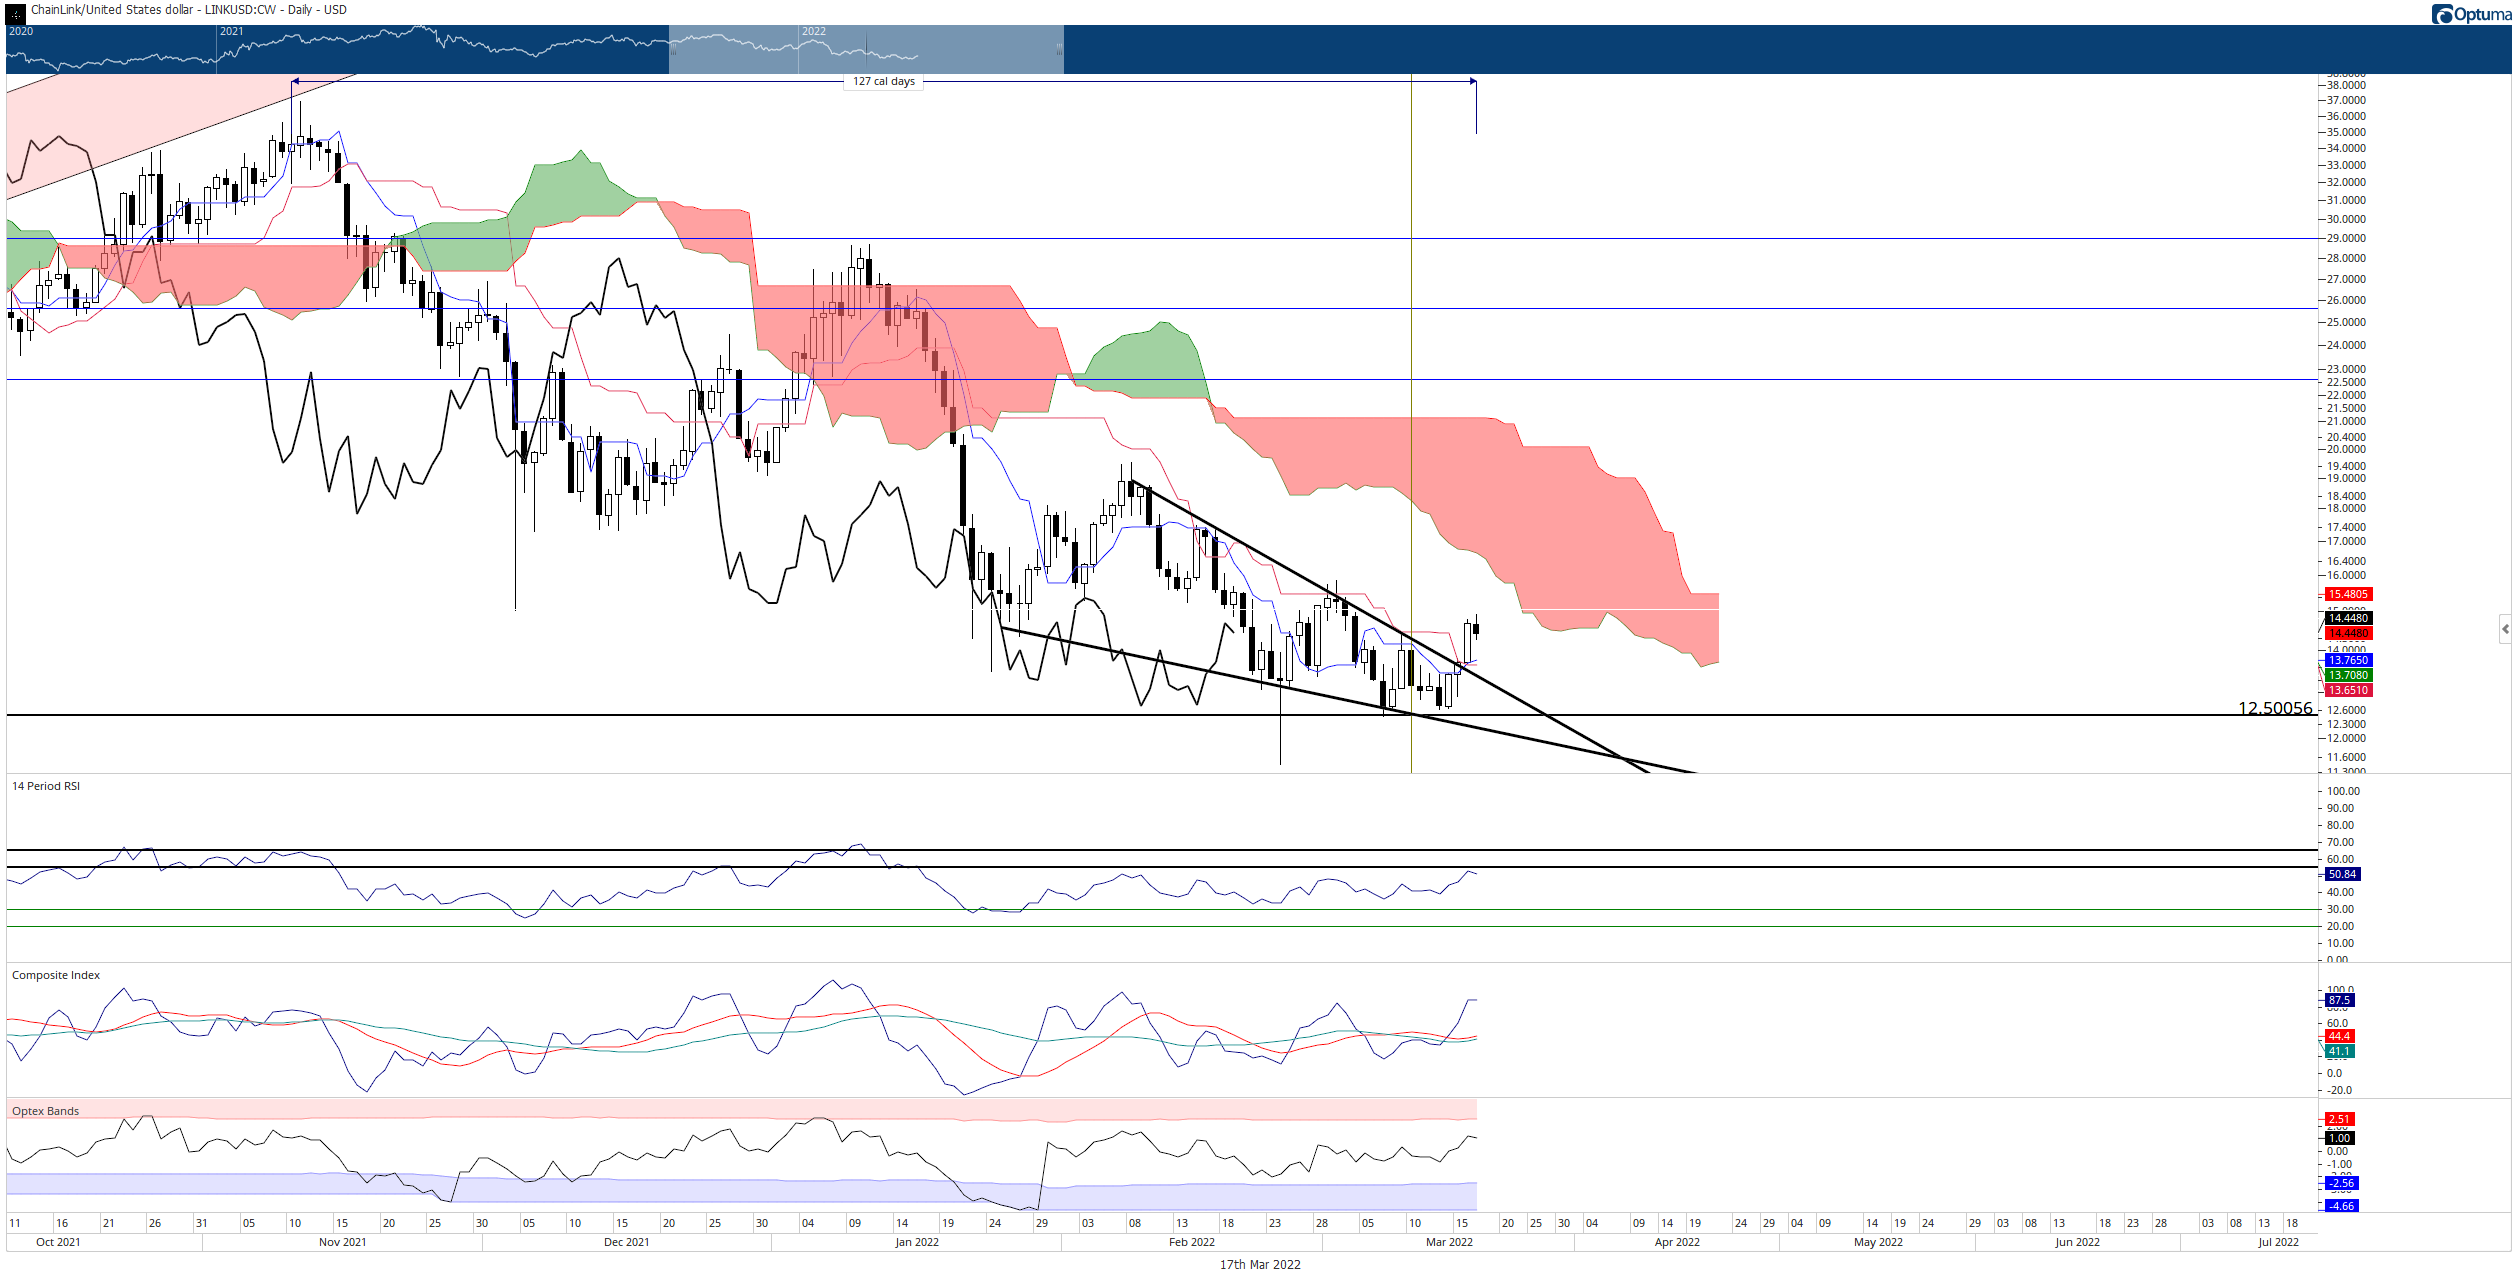
LINK/USDT Daily Ichimoku Kinko Hyo Chart
As a result, the $1/3-box Point and Figure chart sheds a little more light and clarifies where the candlestick chart can’t – a potential buying opportunity is now present for Chainlink price.
The hypothetical long opportunity for Chainlink price is a buy stop at $16, a stop loss at $12, and a profit target at $32. However, while the profit target at $32 is derived from Point and Figure analysis, LINK is more likely to halt at the $25 value area. $25 is a naturally powerful psychological number, but it also contains the 50% Fibonacci retracement and the Kijun-Sen.
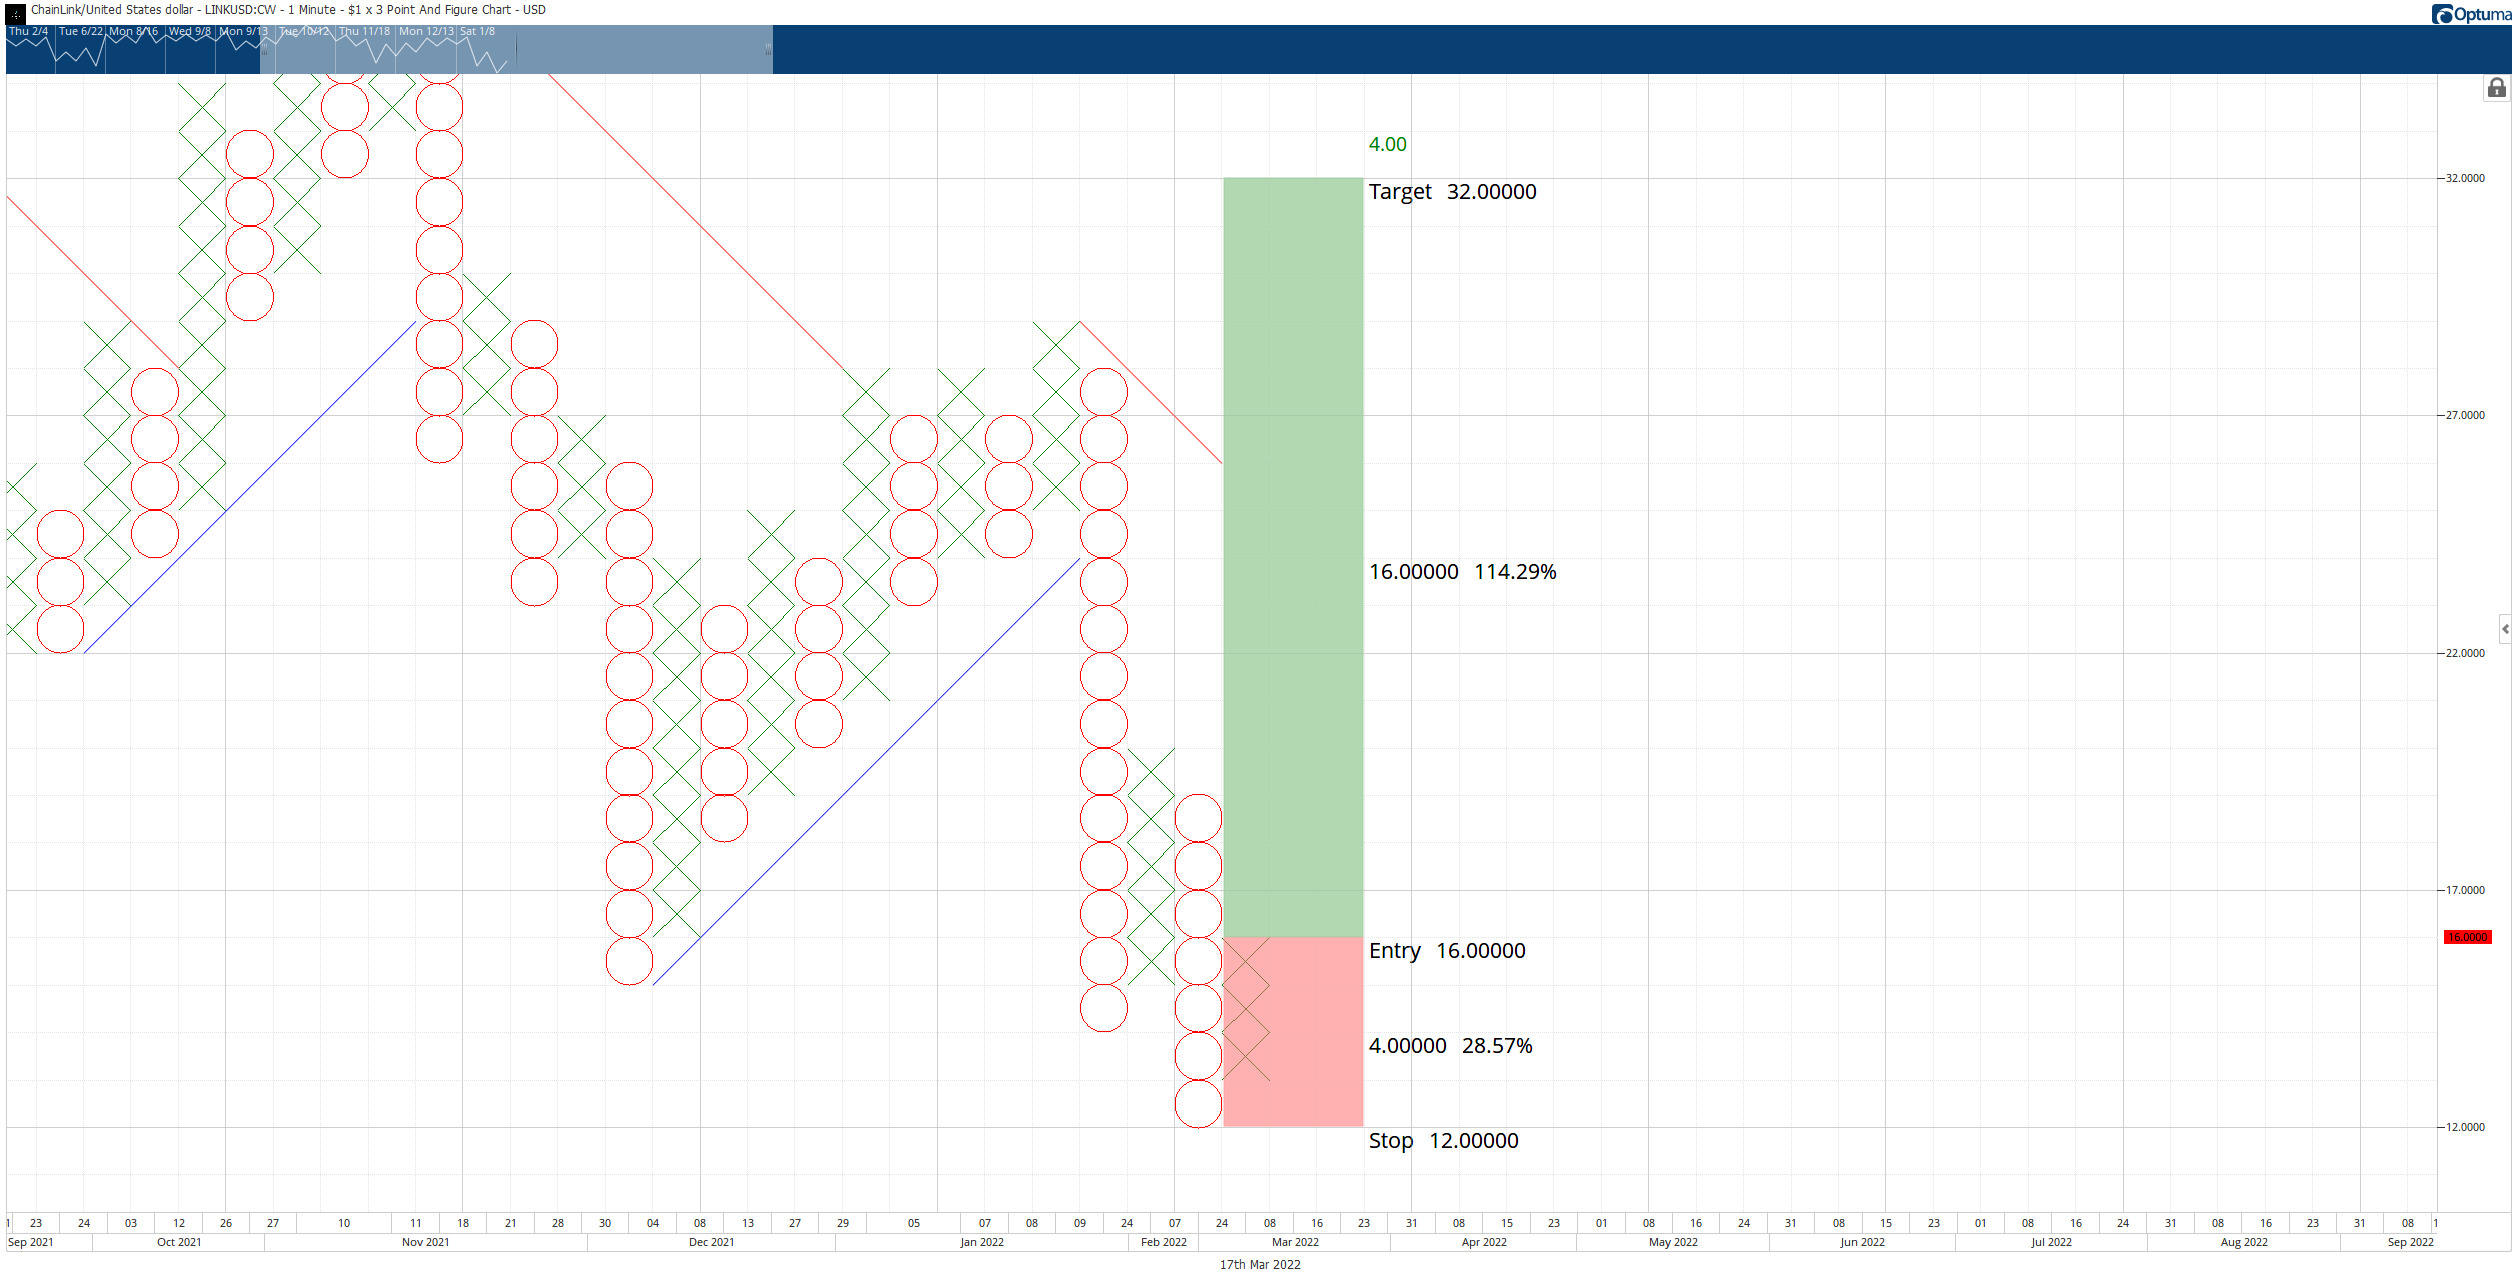
LINK/USDT $1.00/3-box Reversal Point and Figure Chart
The long idea represents a 4:1 reward for the risk setup. A trailing stop of two to three boxes would help protect any implied profit made post entry. The setup is invalidated if Chainlink price drops to $11. Additionally, Point and Figure does not use volume or time – just price – so a time limit or expectation of ‘when’ is moot.
Note: All information on this page is subject to change. The use of this website constitutes acceptance of our user agreement. Please read our privacy policy and legal disclaimer. Opinions expressed at FXstreet.com are those of the individual authors and do not necessarily represent the opinion of FXstreet.com or its management. Risk Disclosure: Trading foreign exchange on margin carries a high level of risk, and may not be suitable for all investors. The high degree of leverage can work against you as well as for you. Before deciding to invest in foreign exchange you should carefully consider your investment objectives, level of experience, and risk appetite. The possibility exists that you could sustain a loss of some or all of your initial investment and therefore you should not invest money that you cannot afford to lose. You should be aware of all the risks associated with foreign exchange trading, and seek advice from an independent financial advisor if you have any doubts.
Recommended Content
Editors’ Picks
Crypto Today: Bitcoin crumbles under German government transfers, Ethereum and Ripple erase gains
![Crypto Today: Bitcoin crumbles under German government transfers, Ethereum and Ripple erase gains](https://editorial.fxstreet.com/images/Markets/Currencies/Digital%20Currencies/Bitcoin/bitcoin-64028817_XtraSmall.jpg)
Bitcoin trades below $57,100 on Thursday as German government transfers continue, $76 million BTC moved to exchanges. Ethereum trades near $3,100 ahead of the upcoming SEC decision on the Spot Ethereum ETF.
Ripple traders take over $75 million in losses in July, XRP drops below key support
![Ripple traders take over $75 million in losses in July, XRP drops below key support](https://editorial.fxstreet.com/images/Markets/Currencies/Cryptocurrencies/Coins/Ripple/ripple_XtraSmall.jpg)
Ripple (XRP) price is under fresh selling pressure and tests key support at the June 7 low of $0.4508 on Thursday as whales are likely capitulating, according to on-chain data.
Bitcoin price declines as supply on exchanges rises
![Bitcoin price declines as supply on exchanges rises](https://editorial.fxstreet.com/images/Markets/Currencies/Digital%20Currencies/Bitcoin/bitcoin_closer_XtraSmall.jpg)
Bitcoin faced rejection at the daily resistance level of $63,956 on Monday, resulting in a 4.2% decline over the next two days. BTC’s price extends its downward move and falls below $58,000 on Thursday, adding more than 4% losses in the day.
Worldcoin is poised for 17% rally as as technical indicators signal bullish momentum
![Worldcoin is poised for 17% rally as as technical indicators signal bullish momentum](https://editorial.fxstreet.com/images/Markets/Currencies/Cryptocurrencies/Worldcoin/Worldcoin_XtraSmall.png)
Worldcoin price finds support and bounces 9% from the weekly support level around $2.183. Technical analysis shows that WLD has formed a bullish divergence on a momentum indicator.
Bitcoin: BTC price correction could end in July, according to seasonal data
![Bitcoin: BTC price correction could end in July, according to seasonal data](https://editorial.fxstreet.com/images/Markets/Currencies/Digital%20Currencies/Bitcoin/bitcoin_5_XtraSmall.jpg)
Bitcoin (BTC) price appears poised for a decline this week, influenced by slight outflows in US spot ETFs, selling activity among BTC miners, and a combined transfer of 4,690.28 BTC to centralized exchanges by the US and German governments.