- Chainlink price is hinting at a pullback that could propel it by 51% to $25.21.
- Bieconomy integrates Chainlink Price Feeds to distribute gas payments in multiple cryptocurrencies.
- A breakdown of the support level at $16.60 will likely invalidate the bullish thesis for LINK.
Chainlink price is setting the stage for a massive bull rally that will shift the trend from bearish and choppy to bullish.
Chainlink Price Feeds and Keepers boost adoption
Bieconomy, a multi-chain transaction infrastructure for Web 3.0 applications, announced its integration of Chainlink Price Feeds on the Ethereum and Polygon mainnet. The project uses current asset prices to assess how much the users pay while using the underlying dApps or the blockchain network.
Therefore, the recent integration allows Bieconomy to calculate execution fees based on the most accurate, tamper-proof and up-to-date asset prices.
Unlike the plethora of projects out there, Bieconomy allows users to choose the token they want to pay the gas fees in, and it does so using their “Forward” module.
Aniket Jindal, the co-founder of Bieconomy, stated,
As we continue on our mission of simplifying web 3.0, Chainlink will act as a critical component in our entire architecture
The DeFi Network is another project that has integrated Chainlink Keepers to support its dynamic artwork efficiently. The Chainlink Price Feeds and Keepers will help sustain “The Curse NFT project,” which is a single dynamic NFT representing a 3D-rendered art piece of Krystall Schott that changes based on the Ethereum price.
While Chainlink Price Feeds monitor and pass the ETH price to the NFT, Chainlink Keepers will,
monitor the price of ETH off-chain, and let The Curse NFT smart contract know if daily price changes were positive or negative.
If the five-day change of ETH price is positive, the NFT will display positively valenced 3D renderings; if not, it will be negatively valenced.
LINK price slows down, anticipating a bounce
LINK price swept the highs at $19.50 and set up a new swing high at $20.54 on June 29. Since then, Chainlink has dropped 8% and might continue to do so until it finds a stable support floor.
The demand barrier at $16.60 is currently expected to support this pullback and serve as a platform for future gains. A bounce from this level will encounter the resistance levels at $19.50 and $24.59 before having a chance to tag the 50% Fibonacci retracement level at $25.21.
This move constitutes a 51% rally from $16.60.
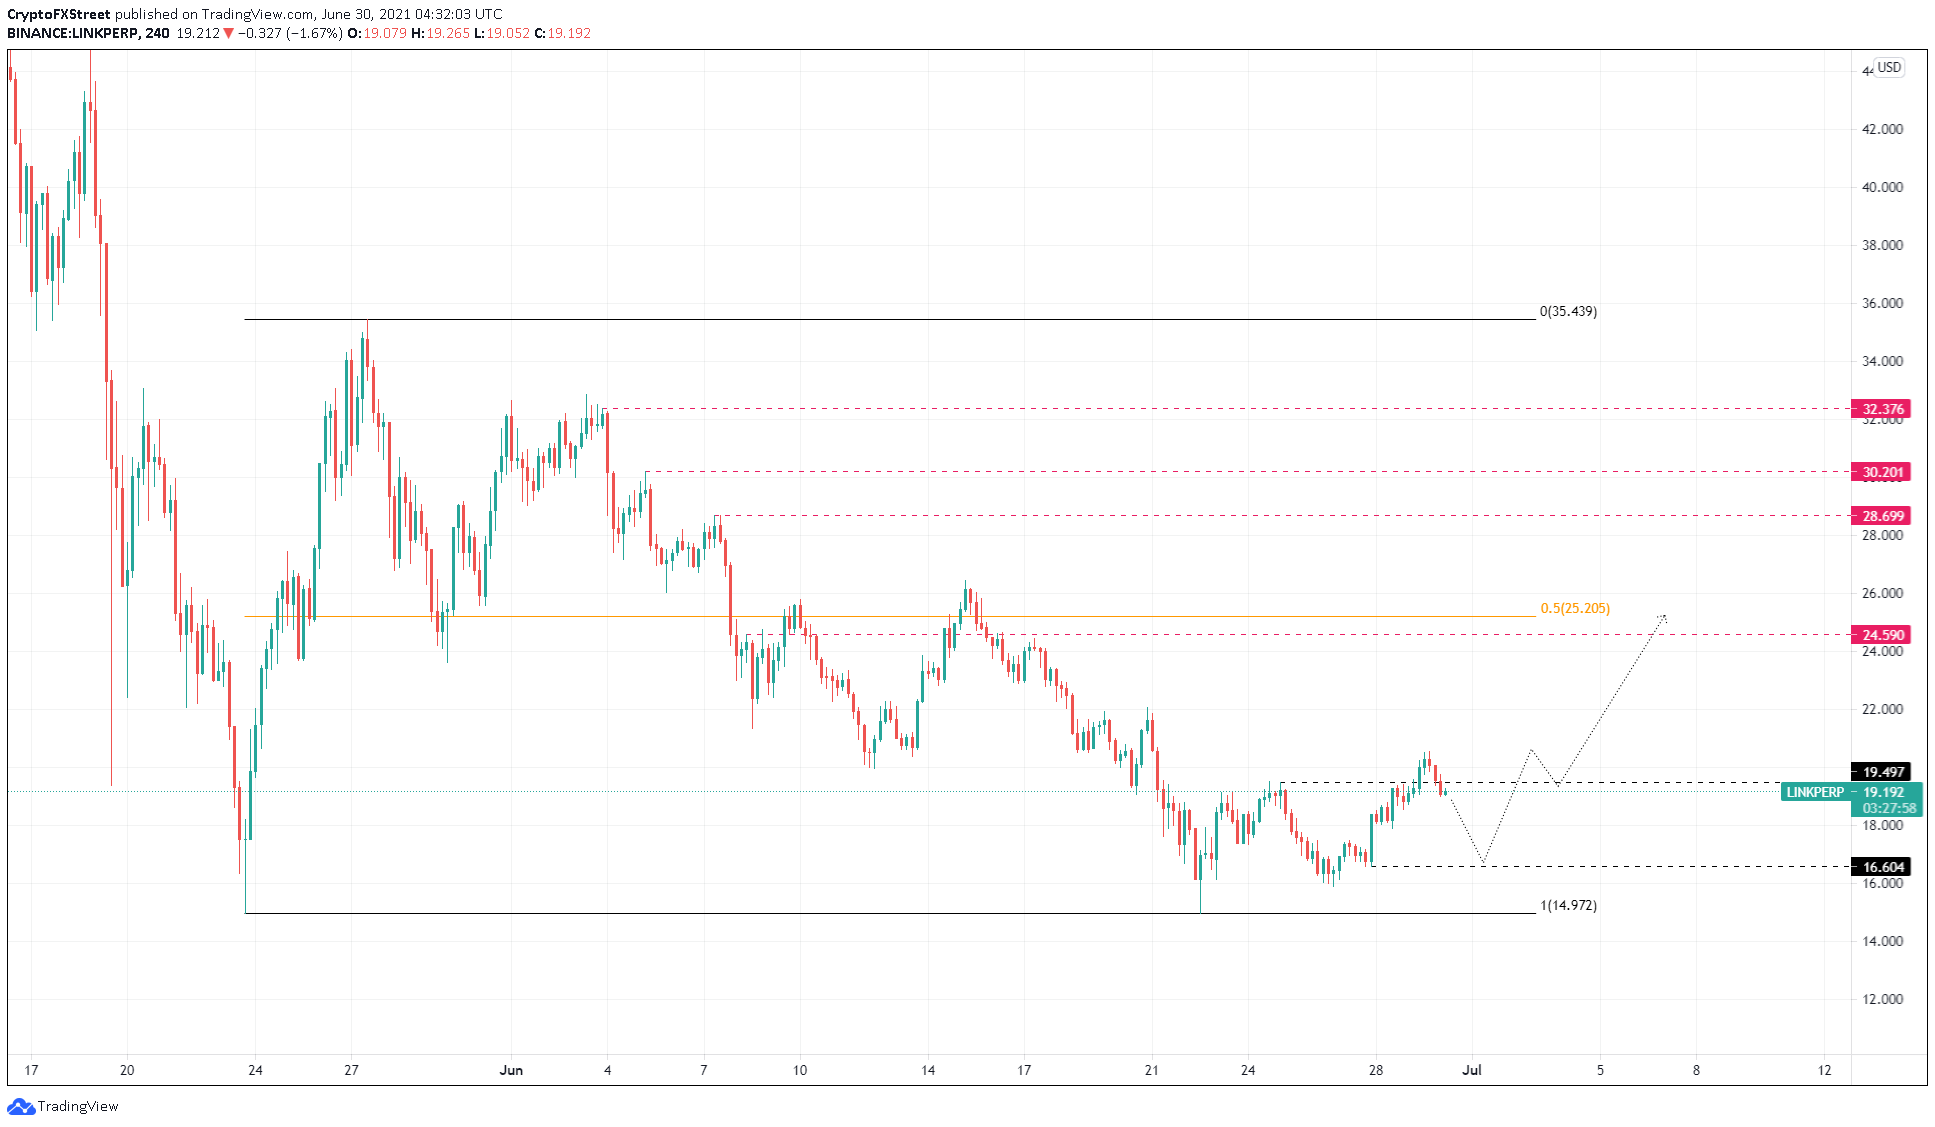
LINK/USDT 4-hour chart
On the flip side, if the support level at $16.60 fails to hold LINK price, it will jeopardize the upswing narrative. In such a case, Chainlink might drop to the range low at $14.97, a breakdown of which will invalidate the bullish thesis.
Information on these pages contains forward-looking statements that involve risks and uncertainties. Markets and instruments profiled on this page are for informational purposes only and should not in any way come across as a recommendation to buy or sell in these assets. You should do your own thorough research before making any investment decisions. FXStreet does not in any way guarantee that this information is free from mistakes, errors, or material misstatements. It also does not guarantee that this information is of a timely nature. Investing in Open Markets involves a great deal of risk, including the loss of all or a portion of your investment, as well as emotional distress. All risks, losses and costs associated with investing, including total loss of principal, are your responsibility. The views and opinions expressed in this article are those of the authors and do not necessarily reflect the official policy or position of FXStreet nor its advertisers. The author will not be held responsible for information that is found at the end of links posted on this page.
If not otherwise explicitly mentioned in the body of the article, at the time of writing, the author has no position in any stock mentioned in this article and no business relationship with any company mentioned. The author has not received compensation for writing this article, other than from FXStreet.
FXStreet and the author do not provide personalized recommendations. The author makes no representations as to the accuracy, completeness, or suitability of this information. FXStreet and the author will not be liable for any errors, omissions or any losses, injuries or damages arising from this information and its display or use. Errors and omissions excepted.
The author and FXStreet are not registered investment advisors and nothing in this article is intended to be investment advice.
Recommended Content
Editors’ Picks
Ripple on-chain metrics show bullish signs amidst legal struggle with SEC, XRP eyes recovery
![Ripple on-chain metrics show bullish signs amidst legal struggle with SEC, XRP eyes recovery](https://editorial.fxstreet.com/images/Markets/Currencies/Cryptocurrencies/Coins/Ripple/Ripple_Coin_31_02_XtraSmall.jpg)
Ripple made a comeback above $0.48 on Tuesday and hovers above that level in Wednesday’s European session. Ripple on-chain metrics such as transaction volume and Network Realized Profit/Loss have turned bullish, supporting a recovery in the altcoin.
Bitcoin price falls amidst German government transfers, miners activity
![Bitcoin price falls amidst German government transfers, miners activity](https://editorial.fxstreet.com/images/Markets/Currencies/Digital%20Currencies/Bitcoin/bit-coin-symbol-flag-3d-illustration-59931110_XtraSmall.jpg)
Bitcoin (BTC) extends correction on Wednesday and hovers around $61,000 after finding resistance near the $64,000 level on Monday. Recent on-chain data indicates heightened selling activity from Bitcoin miners early in the week.
Crypto Today: Bitcoin erases gains from end of June, Ethereum declines while Ripple holds
![Crypto Today: Bitcoin erases gains from end of June, Ethereum declines while Ripple holds](https://editorial.fxstreet.com/images/Markets/Currencies/Digital%20Currencies/Bitcoin/Bitcoin_2_XtraSmall.jpg)
Bitcoin wipes out gains from the last week of June and falls below $60,000 on Wednesday. Ethereum and top altcoins ranked by market capitalization erased gains as the inflation outlook worsened. Ripple holds on to recent gains and hovers above $0.48 on Wednesday.
Three reasons why altcoins could shake off losses this week
![Three reasons why altcoins could shake off losses this week](https://editorial.fxstreet.com/images/Markets/Currencies/Cryptocurrencies/cryptos_XtraSmall.jpg)
On-chain data from Santiment shows that altcoins are currently in the opportunity zone, or generating buy signals. The top three altcoins in the buy zone are Basic Attention Token (BAT), Chromia (CHR), and Highstreet (HIGH), per Santiment.
Bitcoin: BTC price correction could end in July, according to seasonal data
![Bitcoin: BTC price correction could end in July, according to seasonal data](https://editorial.fxstreet.com/images/Markets/Currencies/Digital%20Currencies/Bitcoin/bitcoin_5_XtraSmall.jpg)
Bitcoin (BTC) price appears poised for a decline this week, influenced by slight outflows in US spot ETFs, selling activity among BTC miners, and a combined transfer of 4,690.28 BTC to centralized exchanges by the US and German governments.