Cardano price tests $1, but still not the time to leap into ADA
- Cardano price is trading below the lower trend line of a symmetrical triangle pattern after hitting psychologically important $1.00.
- ADA daily Relative Strength Index (RSI) flashing an oversold condition for the first time since September 2020.
- IntoTheBlock IOMAP metric reveals marginal support down to $0.90, raising the probabilities of a more profound decline.

Cardano price is at an inflection point as it breaks below a multi-week symmetrical triangle and nears the June 22 low. The persuasive technical support at $1.00-$0.89 is undermined by an absence of in the money support, according to the IOMAP metric, suggesting that today’s low will not be the conclusion of the ADA decline that began on July 5.
Cardano price decline exposes a change in cryptocurrency leadership
Cardano price has weaved a complex symmetrical triangle, marked by large swings and relentless support or resistance at the pervasive 2018 high of $1.40. The current leg down of the symmetrical triangle has overcome the ADA support layers defined by the 200-day simple moving average (SMA) at $1.14 and the triangle’s lower trend line around $1.05 before testing $1.00 today. As a result, unveiling an oversold condition on the daily RSI for the first time in almost a year.
The presence of an oversold reading on the daily RSI may establish a temporary ADA low. Still, the governing symmetrical triangle pattern’s measured move projects a 55% reaction for Cardano price and a downside price target of $0.48.
Conversely, Cardano price may be setting a bear trap today, removing weak holders before pursuing a powerful rally that could trigger the upper trend line of the symmetrical triangle, directing ADA towards a 55% gain and a price of $2.10.
Based on the weight of a bearish cryptocurrency market, lead by the stubbornly weak Bitcoin and the rapidly deteriorating technicals for ADA, the projection for Cardano price remains to the downside in the short term.
Cardano price will struggle with support at $1.00, reinforced by the June 22 low of $0.99 and the 61.8% Fibonacci retracement level of the advance from the March 2020 lows at $0.97. A daily close below $0.97 would expose ADA to a test of the April 23 low of $0.89 and a 16% loss from the current price.
An extension of the decline beyond $0.89 will need a decisive catalyst to shake the Cardano price magnet associated with the $1.00-$0.89 range.
Critical to the bearish narrative is for Cardano price to close today below the triangle’s lower trend line around $1.06. A failure to maintain the weakness would hint that today’s early rout was a bear trap.
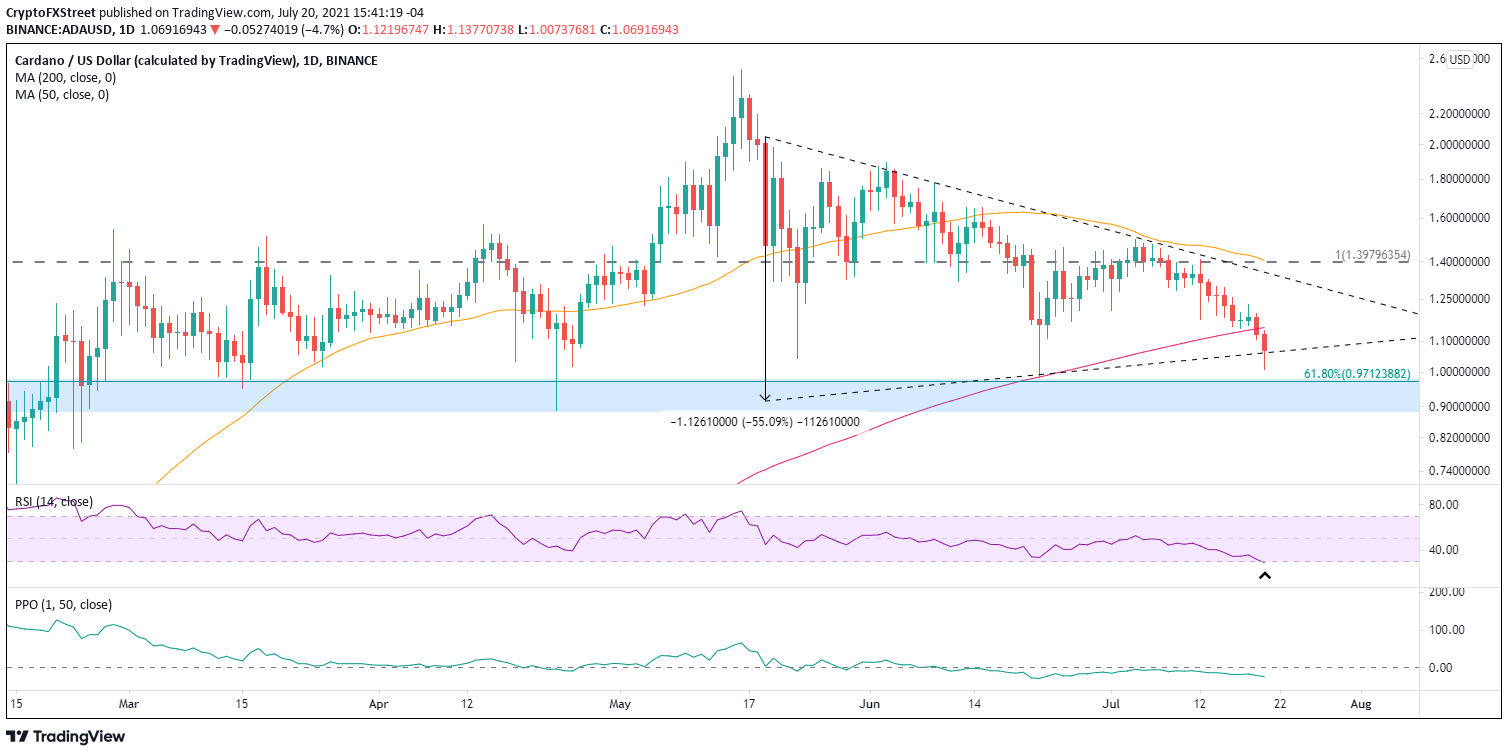
ADA/USD daily chart
If there is a reversal of fortune for Cardano price, the first objective is to close above the 200-day SMA at $1.14. Once above the strategically important moving average, ADA may steal some price traction and focus on the symmetrical triangle’s upper trend line around $1.35, providing an 18% gain from the moving average. Any further strength will be promptly extinguished by the convergence of the 50-day SMA with the 2018 high, both currently at $1.40.
The timely IntoTheBlock In/Out of the Money Around Price (IOMAP) metric supports the technical levels as Cardano shows virtually no support (in the money addresses) down to $0.90.
Conversely, the resistance (out of the money addresses) is significant, beginning with the price cluster of $1.13-$1.16, where 75.69k addresses hold 1.48 billion ADA at an average price of $1.14. The average price corresponds to the 200-day SMA, also at $1.14.
The second cluster of resistance emerges at $1.19-$1.22, where 111.14k addresses hold 1.47 billion ADA at an average price of $1.20, indicating that even if Cardano price does break the 200-day SMA, it will immediately meet heavy selling pressure.
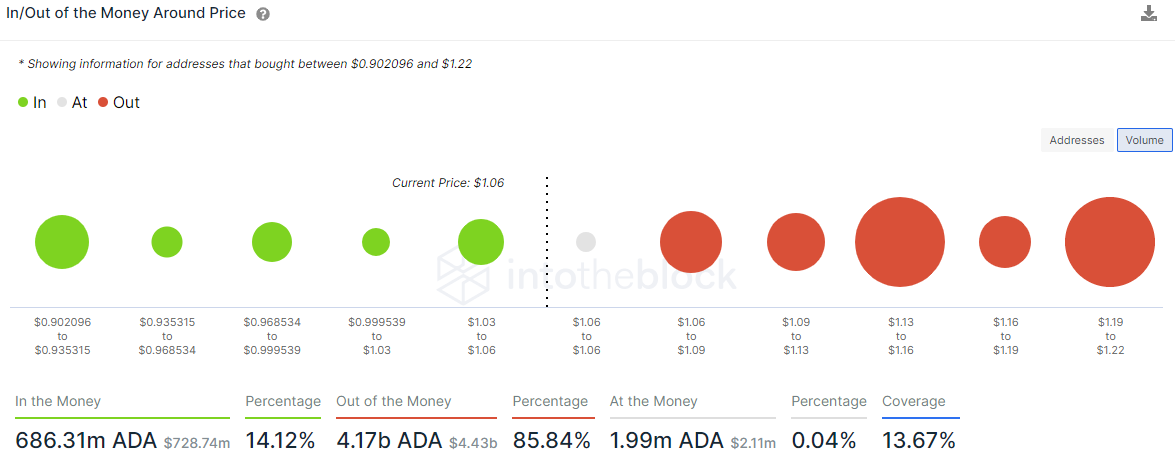
ADA IOMAP - IntoTheBlock
It is interesting how the IOMAP metric levels correlate closely with the technical levels on the charts, affirming the need for ADA investors to take the levels seriously when making investment decisions.
Despite the compelling fundamental narrative, Cardano price was unable to shake the weakness in the cryptocurrency complex, leaving it struggling to maintain critical support levels. For now, with the altcoin down 23% in July, ADA investors are best served by watching, not leaping into the weakness.
Author

Sheldon McIntyre, CMT
Independent Analyst
Sheldon has 24 years of investment experience holding various positions in companies based in the United States and Chile. His core competencies include BRIC and G-10 equity markets, swing and position trading and technical analysis.


