Cardano price struggles with recovery as ADA bulls confront challenges ahead
- Cardano price continues to be stuck in a consolidation pattern.
- ADA is attempting to target higher levels as the token rebounds from the lower boundary of the prevailing chart pattern.
- Cardano dropping below $1.00 could spell further trouble for the bulls.

Cardano price is struggling to lift prices higher although selling pressure eased. ADA may continue to be sealed in a consolidation chart pattern as the token confronts stiff resistances ahead while the buyers attempt to target higher levels.
Cardano price eyes major rebound
Cardano price is locked within a descending parallel channel pattern on the daily chart, suggesting that the token may continue to move sideways.
ADA has treaded above the lower boundary of the prevailing chart pattern at $1.00 as a reliable support. Cardano price will face the first line of resistance at the 38.2% Fibonacci retracement level at $1.19.
An additional hurdle will emerge at the 50-day Simple Moving Average (SMA) at $1.28, coinciding with the 50% retracement level and the middle boundary of the governing technical pattern.
Cardano price may be confronted with another challenge at the 78.6% Fibonacci retracement level at $1.48, before the bulls target the upper boundary of the prevailing chart pattern at $1.56, intersecting with the 100-day SMA.
Slicing above the topside trend line of the governing technical pattern may signal that the bulls have reversed the period of underperformance, putting further gains on the horizon.
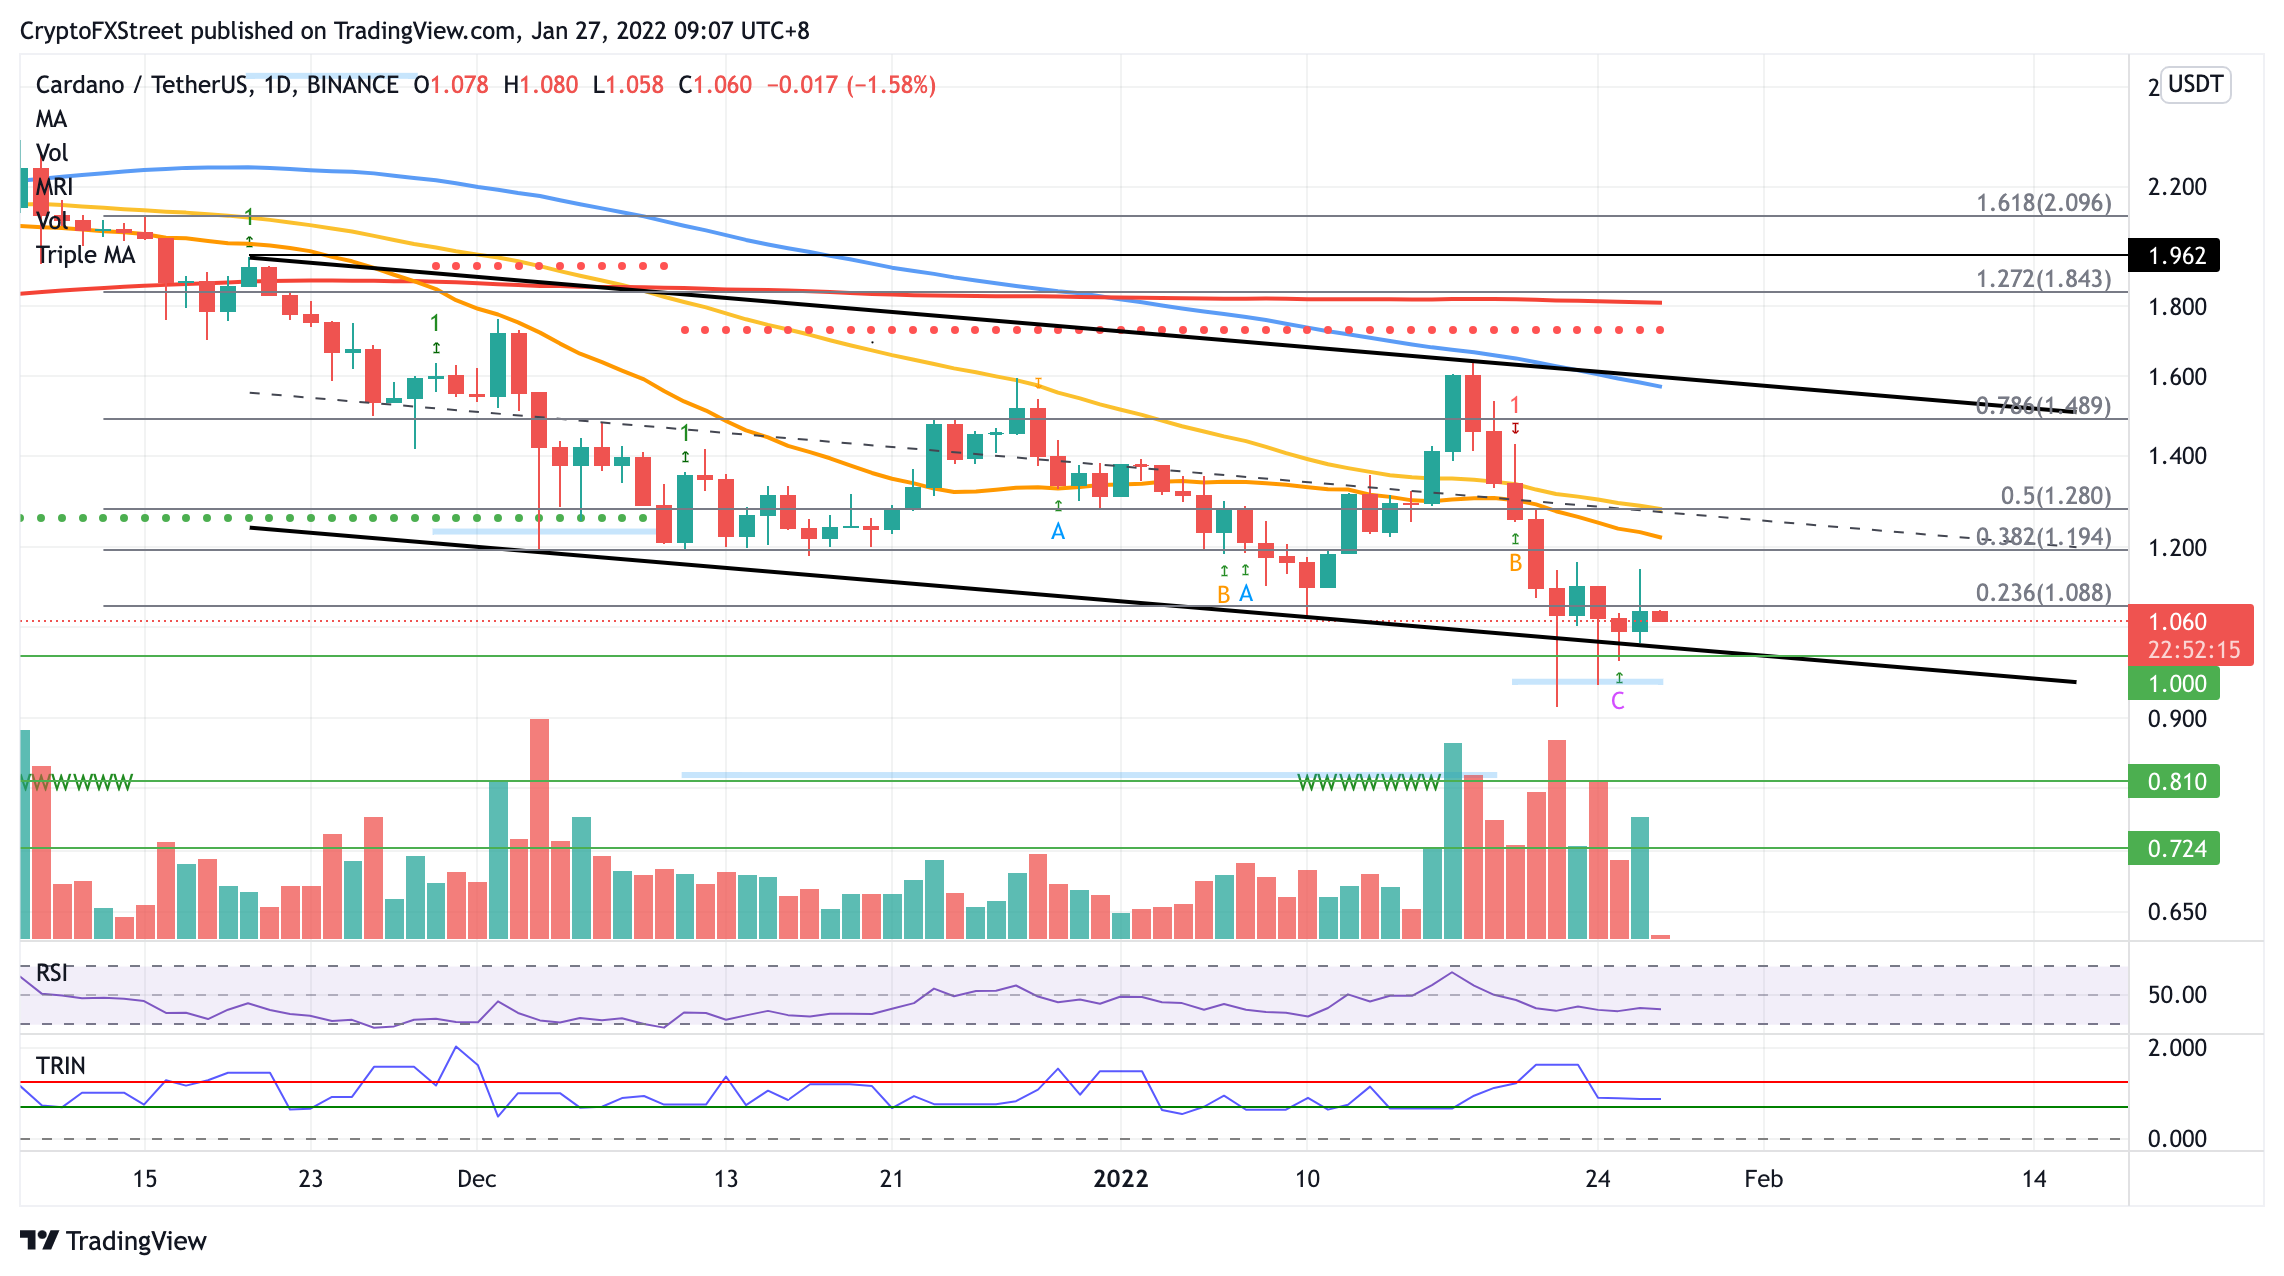
ADA/USDT daily chart
Bigger aspirations will target the 127.2% Fibonacci retracement level at $1.84.
However, if selling pressure increases, Cardano price could fall toward the 23.6% Fibonacci retracement level at $1.08 before ADA slides toward the lower boundary of the prevailing chart pattern at $1.00.
If Cardano price breaks below the downside trend line of the descending parallel channel, ADA could slide toward the demand zone that stretches from $0.72 to $0.81.
RELATED CONTENT
Why Bitcoin price could form a bottom following the January 28 options expiry
Bitcoin price fell below the psychological level of $40,000 as support, sliding toward a swing low near $33,000. Liquidations across trading platforms were significant, with Bitcoin positions accounting for $292 million. BTC dropped over 50% from its all-time high on November 21, marking one of the most significant pullbacks since. The options expiry on January 21 benefitted the bears, as Bitcoin price dipped below $40,000, while the maximum pain level was at $41,000, which is the price at which BTC would cause financial losses for the largest number of options holders at expiration. Since maximum pain is the option’s strike price for which the most number of options contracts will expire worthlessly, the theory suggests that the asset price, Bitcoin will gravitate toward the max pain price as it heads toward option expiry. The theory indicates that market makers will attempt to remain hedged against their open interest, by shorting or longing the futures market. There is a large incentive for market makers to manipulate spot prices closer toward the maximum pain price.Read more
Author

Sarah Tran
Independent Analyst
Sarah has closely followed the growth of blockchain technology and its adoption since 2016.


