- Cardano price sees both bid and ask sides caught in a tight range between two technical forces.
- ADA price set for a bullish breakout as positive sentiment is gaining momentum in global markets.
- A daily close above $1.00 sets the scene for a 65% upswing, making new highs for 2022.
Cardano (ADA) price sees bears and bulls getting squeezed toward each other since the latter were able to break above the 55-day Simple Moving Average on Tuesday at $0.957. From the topside, the significant $1.00 barrier is doing its part to refrain bulls from entering above with short-sellers selling massively to maintain price action subdued. With the current tailwinds and technical setup, the coin is set to flip in favor of the bulls with a breakout above $1.00, which will open the door to a big area that could hold 65% gains, with ADA price hitting $1.677.
Cardano price set for a swing trade towards $1.677
Cardano price has hurt many bears on Tuesday by covering a lot of ground to the upside, as a rally is picking up speed. Help came from global tailwinds that are pushing equities and cryptocurrencies higher. Although bulls hit a curb at $1.00, expect to see a breakthrough anytime soon as momentum is building for a bullish breakout with tailwinds overpowering bearish price action.
ADA price could be thus in for some solid gains that could mount up to 65%, towards $1.677 in what would be a perfect swing trade and possibly even print new highs for 2022. That is a more longer-term trade as, in the near-term, the Relative Strength Index (RSI) is still offering some room for upside but is starting to look topish, near overbought. Expect this week for bulls to focus on $1.25 with the monthly R1 just below as the anchor point.
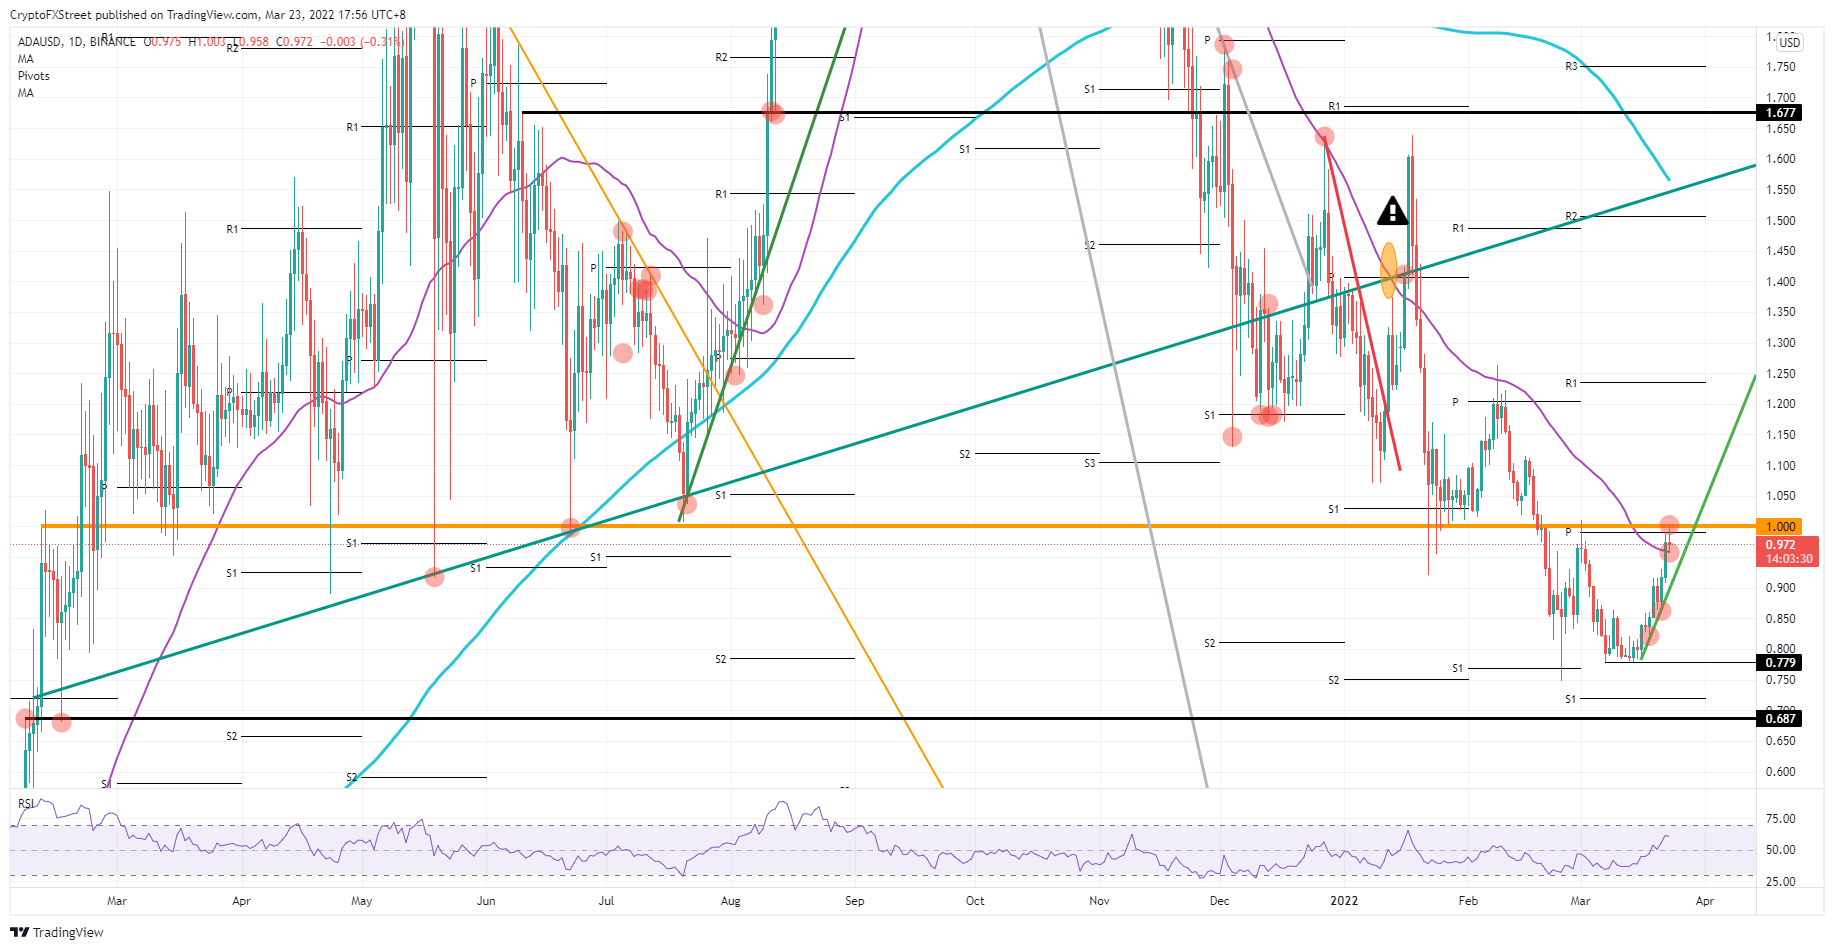
ADA/USD daily chart
Risk to the downside comes with bulls unable to break above $1.00, and that failed test becomes an actual rejection to the upside. That would trigger the green light for bears to go in and fill every buy-order present to evaporate the demand and push price action back to the green ascending trend line that has already held on two previous occasions. Expect either a bounce off the trend line around $0.90, and with a break a full completion of the descent back to $0.779.
Information on these pages contains forward-looking statements that involve risks and uncertainties. Markets and instruments profiled on this page are for informational purposes only and should not in any way come across as a recommendation to buy or sell in these assets. You should do your own thorough research before making any investment decisions. FXStreet does not in any way guarantee that this information is free from mistakes, errors, or material misstatements. It also does not guarantee that this information is of a timely nature. Investing in Open Markets involves a great deal of risk, including the loss of all or a portion of your investment, as well as emotional distress. All risks, losses and costs associated with investing, including total loss of principal, are your responsibility. The views and opinions expressed in this article are those of the authors and do not necessarily reflect the official policy or position of FXStreet nor its advertisers. The author will not be held responsible for information that is found at the end of links posted on this page.
If not otherwise explicitly mentioned in the body of the article, at the time of writing, the author has no position in any stock mentioned in this article and no business relationship with any company mentioned. The author has not received compensation for writing this article, other than from FXStreet.
FXStreet and the author do not provide personalized recommendations. The author makes no representations as to the accuracy, completeness, or suitability of this information. FXStreet and the author will not be liable for any errors, omissions or any losses, injuries or damages arising from this information and its display or use. Errors and omissions excepted.
The author and FXStreet are not registered investment advisors and nothing in this article is intended to be investment advice.
Recommended Content
Editors’ Picks

Bitcoin Weekly Forecast: BTC remains calm before a storm
Bitcoin price has been consolidating between $85,000 and $88,000 this week, approaching the lower boundary of the consolidation range when writing on Friday. A K33 Research report explains how the markets are relatively calm and shaping up for volatility as investors absorb the tariff announcements.

Donald Trump’s tariff policies set to increase market uncertainty and risk-off sentiment
US President Donald Trump’s tariff policies are expected to escalate market uncertainty and risk-off sentiment, with the Kobeissi Letter’s post on X this week cautioning that while markets may view the April 2 tariffs as the "end of uncertainty," it anticipates increased volatility.

Ethereum Price Forecast: Whales increase buying pressure as developers set April 30 for Pectra mainnet upgrade
Ethereum developers tentatively scheduled the Pectra mainnet upgrade for April 30 in the latest ACDC call. Whales have stepped up their buying pressure in hopes of a price uptick upon Pectra going live on mainnet.

BTC stabilizes while ETH and XRP show weakness
Bitcoin price stabilizes at around $87,000 on Friday, as its RSI indicates indecisiveness among traders. However, Ethereum and Ripple show signs of weakness as they face resistance around their key levels and face a pullback this week.
Bitcoin: BTC remains calm before a storm
Bitcoin (BTC) price has been consolidating between $85,000 and $88,000 this week, approaching the lower boundary of the consolidation range when writing on Friday.

The Best brokers to trade EUR/USD
SPONSORED Discover the top brokers for trading EUR/USD in 2025. Our list features brokers with competitive spreads, fast execution, and powerful platforms. Whether you're a beginner or an expert, find the right partner to navigate the dynamic Forex market.