- Cardano price on the backfoot as price undergoes bearish squeeze
- ADA price action sees bears profiting from some open room still to go to the downside
- Expect to see pressure mounting, resulting in a possible 15% drop intraday to $0.687
Cardano (ADA) price is undergoing a classic technical squeeze to the downside as lower highs are pushing bulls against a floor, though that floor is holding for now. As the squeeze looks ready to break below current levels, expect to see a violent and quick drop that historically looks to complete a swing trade. Once the swing trade completes expect to see bulls coming in and performing a bounce-off as a prepositioning move for a bull run.
Also read: Gold Price Forecast: XAUUSD reaches fresh weekly lows near $1,900
Cardano price set to perform falling knife under massive bearish pressure
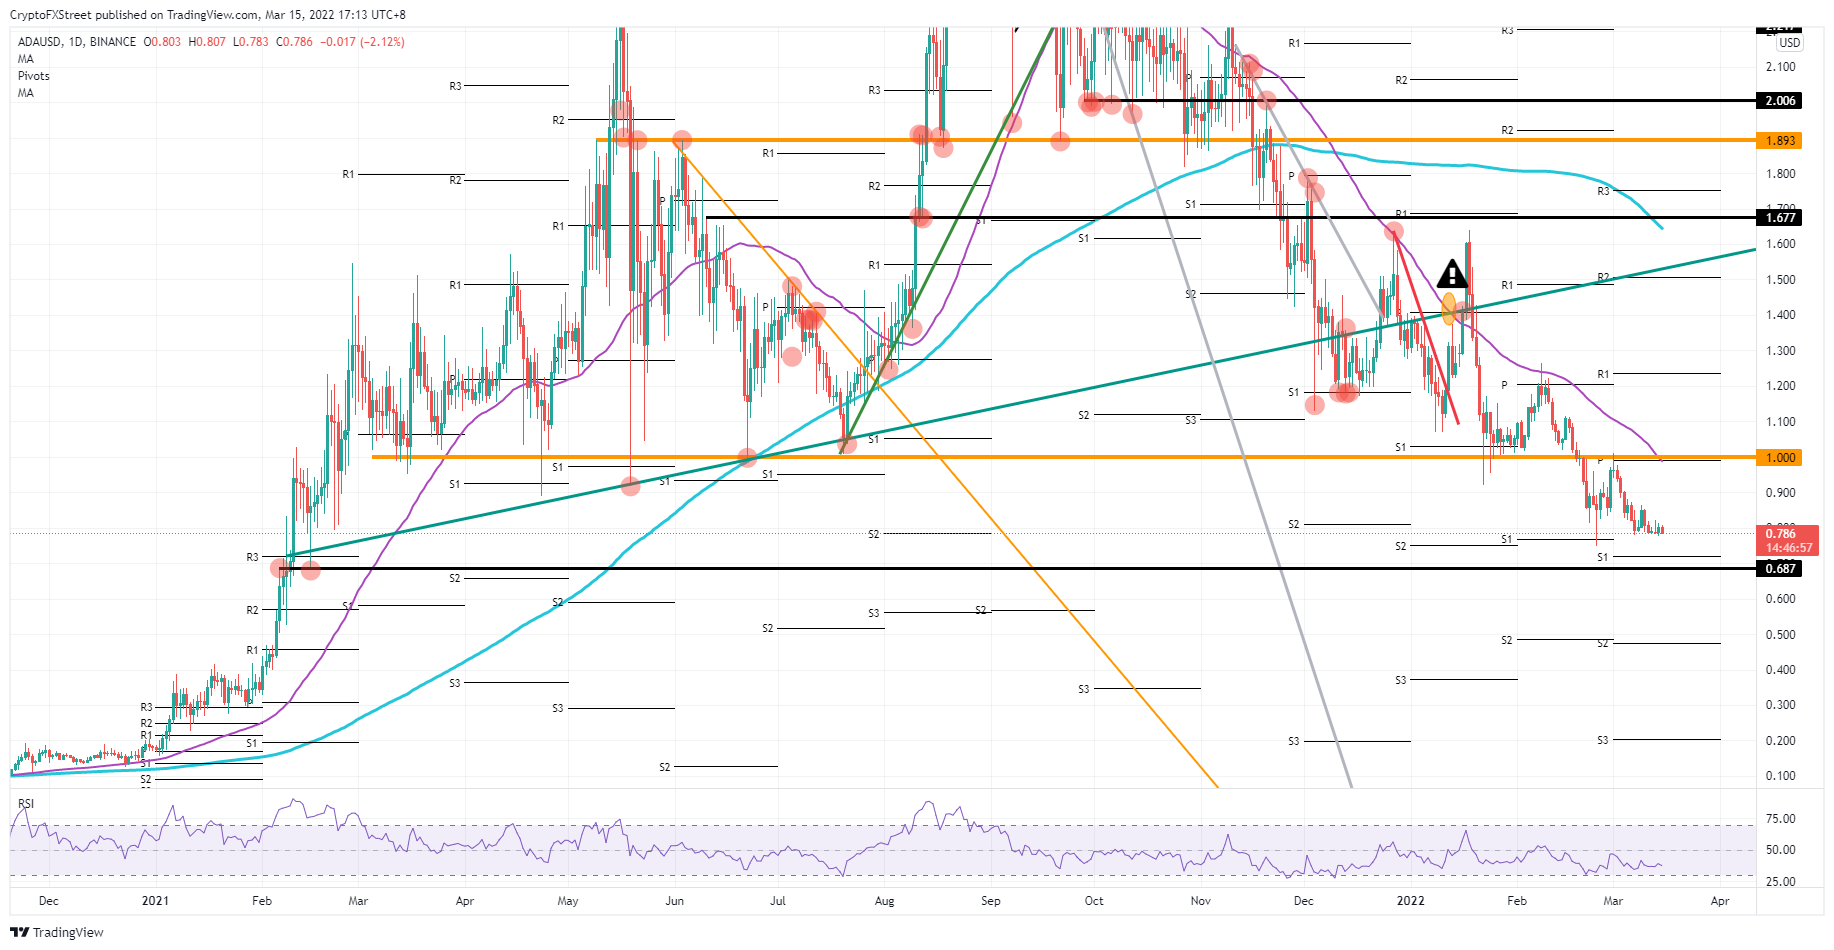
Cardano price is under siege by bears as they use a window of opportunity to push price action even further to the downside. Headwinds from stalled peace talks between Russia and Ukraine are only building the case for further bearish price action in ADA. With the Relative Strength Index (RSI) not in oversold territory yet, a window of opportunity is there for bears to squeeze out another 15% devaluation in price action.
ADA price action sees this pressure mounting as lower highs are formed against a flat bottom at $0.785. Expect to see a sharp break triggered by any form of negative headline coming out or the Nasdaq tanking by over 1% again. A break below $0.785 is not likely to see much support along the way until $0.720 at the monthly S1 support level. Perhaps more important is $0.687, a level that goes back to February 15, 2021, and will be the endpoint of a swing trade that lasted for over a year.
ADA/USD daily chart
Either the break, and then bounce off the monthly S1 support, or the $0.687 technical level could be levels that sees bulls returning to the scene. With the swing trade completed, a technical bounce-off would fit the narrative and have investors look beyond the current dire situation on the world stage to the potential that lies ahead, and a relief rally once a truce is signed and commitments have been made between Russia and Ukraine. A countermove would result in at least a return to $1.00, the monthly pivot and the 55-day Simple Moving Average as a counterweight to pause the bull rally from overheating.
Information on these pages contains forward-looking statements that involve risks and uncertainties. Markets and instruments profiled on this page are for informational purposes only and should not in any way come across as a recommendation to buy or sell in these assets. You should do your own thorough research before making any investment decisions. FXStreet does not in any way guarantee that this information is free from mistakes, errors, or material misstatements. It also does not guarantee that this information is of a timely nature. Investing in Open Markets involves a great deal of risk, including the loss of all or a portion of your investment, as well as emotional distress. All risks, losses and costs associated with investing, including total loss of principal, are your responsibility. The views and opinions expressed in this article are those of the authors and do not necessarily reflect the official policy or position of FXStreet nor its advertisers. The author will not be held responsible for information that is found at the end of links posted on this page.
If not otherwise explicitly mentioned in the body of the article, at the time of writing, the author has no position in any stock mentioned in this article and no business relationship with any company mentioned. The author has not received compensation for writing this article, other than from FXStreet.
FXStreet and the author do not provide personalized recommendations. The author makes no representations as to the accuracy, completeness, or suitability of this information. FXStreet and the author will not be liable for any errors, omissions or any losses, injuries or damages arising from this information and its display or use. Errors and omissions excepted.
The author and FXStreet are not registered investment advisors and nothing in this article is intended to be investment advice.
Recommended Content
Editors’ Picks

US SEC Crypto Task Force to host the first-ever roundtable on crypto asset regulation
The US Securities and Exchange Commission Crypto Task Force will host a series of roundtables to discuss key areas of interest in regulating crypto assets. The “Spring Sprint Toward Crypto Clarity” series’ first-ever roundtable begins on Friday.

Bitcoin stabilizes around $84,000 despite US SEC regularity clarity and Fed rate stability
Bitcoin price stabilizes around $84,000 at the time of writing on Friday after recovering nearly 2% so far this week. The recent announcement by the US SEC that Proof-of-Work mining rewards are not securities could boost BTC investors' confidence.

BTC, ETH and XRP stabilize as SEC Crypto Task Force prepares for First roundtable discussion
Bitcoin (BTC) price hovers around $84,500 on Friday after recovering nearly 3% so far this week. Ethereum (ETH) and Ripple (XRP) find support around their key levels, suggesting a recovery on their cards.

XRP sees growing investor confidence following SEC ending legal battle against Ripple
XRP whale holdings and network activity signal rising optimism among investors. However, signs of bearish sentiment in the derivatives market could hamper XRP's price growth.

Bitcoin: BTC stabilizes around $84,000 despite US SEC regularity clarity and Fed rate stability
Bitcoin (BTC) price stabilizes around $84,000 at the time of writing on Friday after recovering nearly 2% so far this week. The recent announcement by the United States (US) Securities and Exchange Commission (SEC) that Proof-of-Work (PoW) mining rewards are not securities could boost BTC investors' confidence.

The Best brokers to trade EUR/USD
SPONSORED Discover the top brokers for trading EUR/USD in 2025. Our list features brokers with competitive spreads, fast execution, and powerful platforms. Whether you're a beginner or an expert, find the right partner to navigate the dynamic Forex market.
