Cardano Price Projection: ADA poised for a 270% upswing
- Cardano price showing an equilibrium between buyers and sellers.
- 10-week simple moving average (SMA) has now caught up to price.
- Pennant continuation pattern forming just below 2018 high.

Cardano price climbed 270% in February on the highest monthly volume total since the digital coin inception in 2017. The correction process through March and early April has formed a pennant continuation pattern that includes two weekly dojis. The price contraction combined with the balance between buyers and sellers has put ADA in a timely position for a breakout to the upside.
Cardano price at an inflection point for the longer trend
Pennant patterns are frequent with quick and reliable outcomes. Prices tend to rally immediately with few throwbacks or pullbacks and have a very low failure rate. Pennants follow sharp price moves and often move horizontally to the preceding rally. A contraction in volume usually complements this.
Dojis are single candlestick patterns that demonstrate an equilibrium between buyers and sellers. A period of indecision, often waiting for a catalyst to trigger the breakout. When combined with the pennant’s contracting price action, this type of candlestick puts ADA in a rare but timely position for a significant rally. Moreover, the arriving support of the 10-week SMA only raises the odds of an upside breakout.
A renewal of the rally puts ADA on pace to quickly test the 1.618 Fibonacci extension of the March correction at $2.08 and then the 2.618 extension level at $3.39.
The measured move target for the ‘Ethereum killer’ is based on the February rally and is at $5.25, representing a 270% gain from the pennant breakout price. It comes close to the 3.618 extension level at $5.50.
To embrace the bullish spirit and since ADA is trying to breakout from a multi-year base, it is appropriate to consider the 1.382 extension of the 2018-2020 bear market at $7.55.
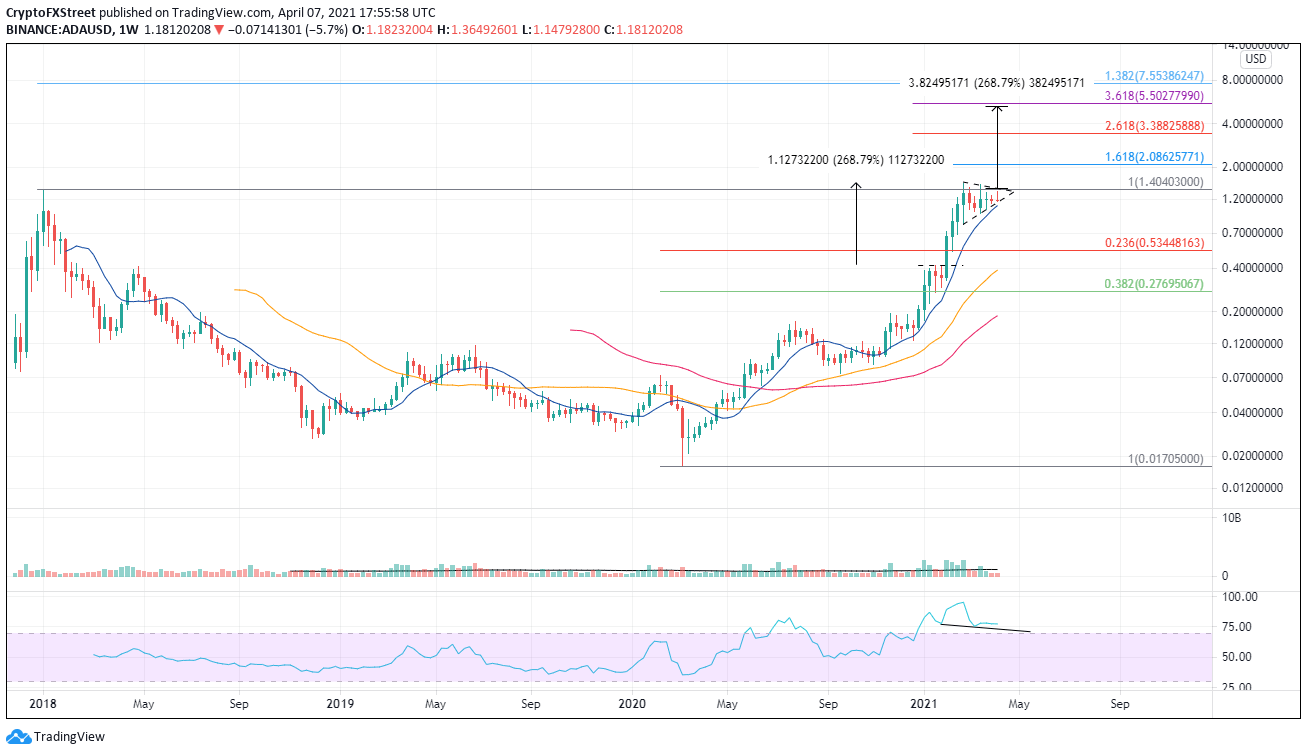
ADA/USD weekly chart
Consistent with the balance between buyers and sellers, the IntoTheBlock’s In/Out of the Money Around Price (IOMAP) data shows a slightly more out of the money volume at the moment. It could provide some resistance, but support will be abundant between $1.12 to $1.15, which correlates with the pennant formation’s lower trendline.
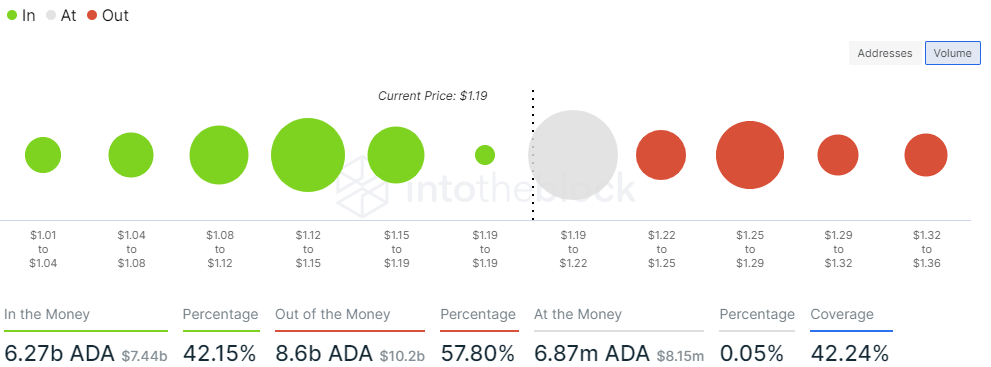
Cardano GIOM chart
All patterns carry the risk of failure, so traders need to watch the lower trendline and the 10-week SMA for heavy support. A weekly close below the evident support does expose ADA to a significant decline that may not pause until the 0.236 retracement of the 2020-2021 bull market at $0.53.
In summary, the breakout direction should be expected in the direction of the preceding trend, particularly considering the steepness and the power. As such, these probabilities favor a bullish resolution in the coming days.
Author

Sheldon McIntyre, CMT
Independent Analyst
Sheldon has 24 years of investment experience holding various positions in companies based in the United States and Chile. His core competencies include BRIC and G-10 equity markets, swing and position trading and technical analysis.