Cardano Price Prediction: ADA might be due for 10% correction
- Cardano price pierced the supply zone that extends from $1.44 to $1.5 as it rallied 18% in nearly four days.
- The MRI flashed a sell signal, indicating that this uptrend is at its end.
- A 10% pullback to the trading range’s mid-point at $1.304 will most likely occur.

Cardano price is currently experiencing a tussle between the bulls and bears as it enters a crucial supply zone. Therefore, investors can expect a minor pullback before the bulls make a comeback.
Cardano price at an inflection point
Cardano price rallied roughly 18% from its August 3 swing low at $1.26 to set up a swing high at $1.48. While this uptrend was expected, the Momentum Reversal Indicator (MRI) flashed a sell signal in the form of a red ‘one’ candlestick on the 12-hour chart.
This technical formation forecasts a one-to-four candlestick correction. Therefore, investors can expect ADA to pull back shortly.
The $1.374 support level is the most likely candidate to absorb the selling pressure from the correction, but in some cases, a breach of this level could extend the retracement to $1.304, the trading range’s midpoint.
This move would represent a 10% downswing from the current position, $1.46.
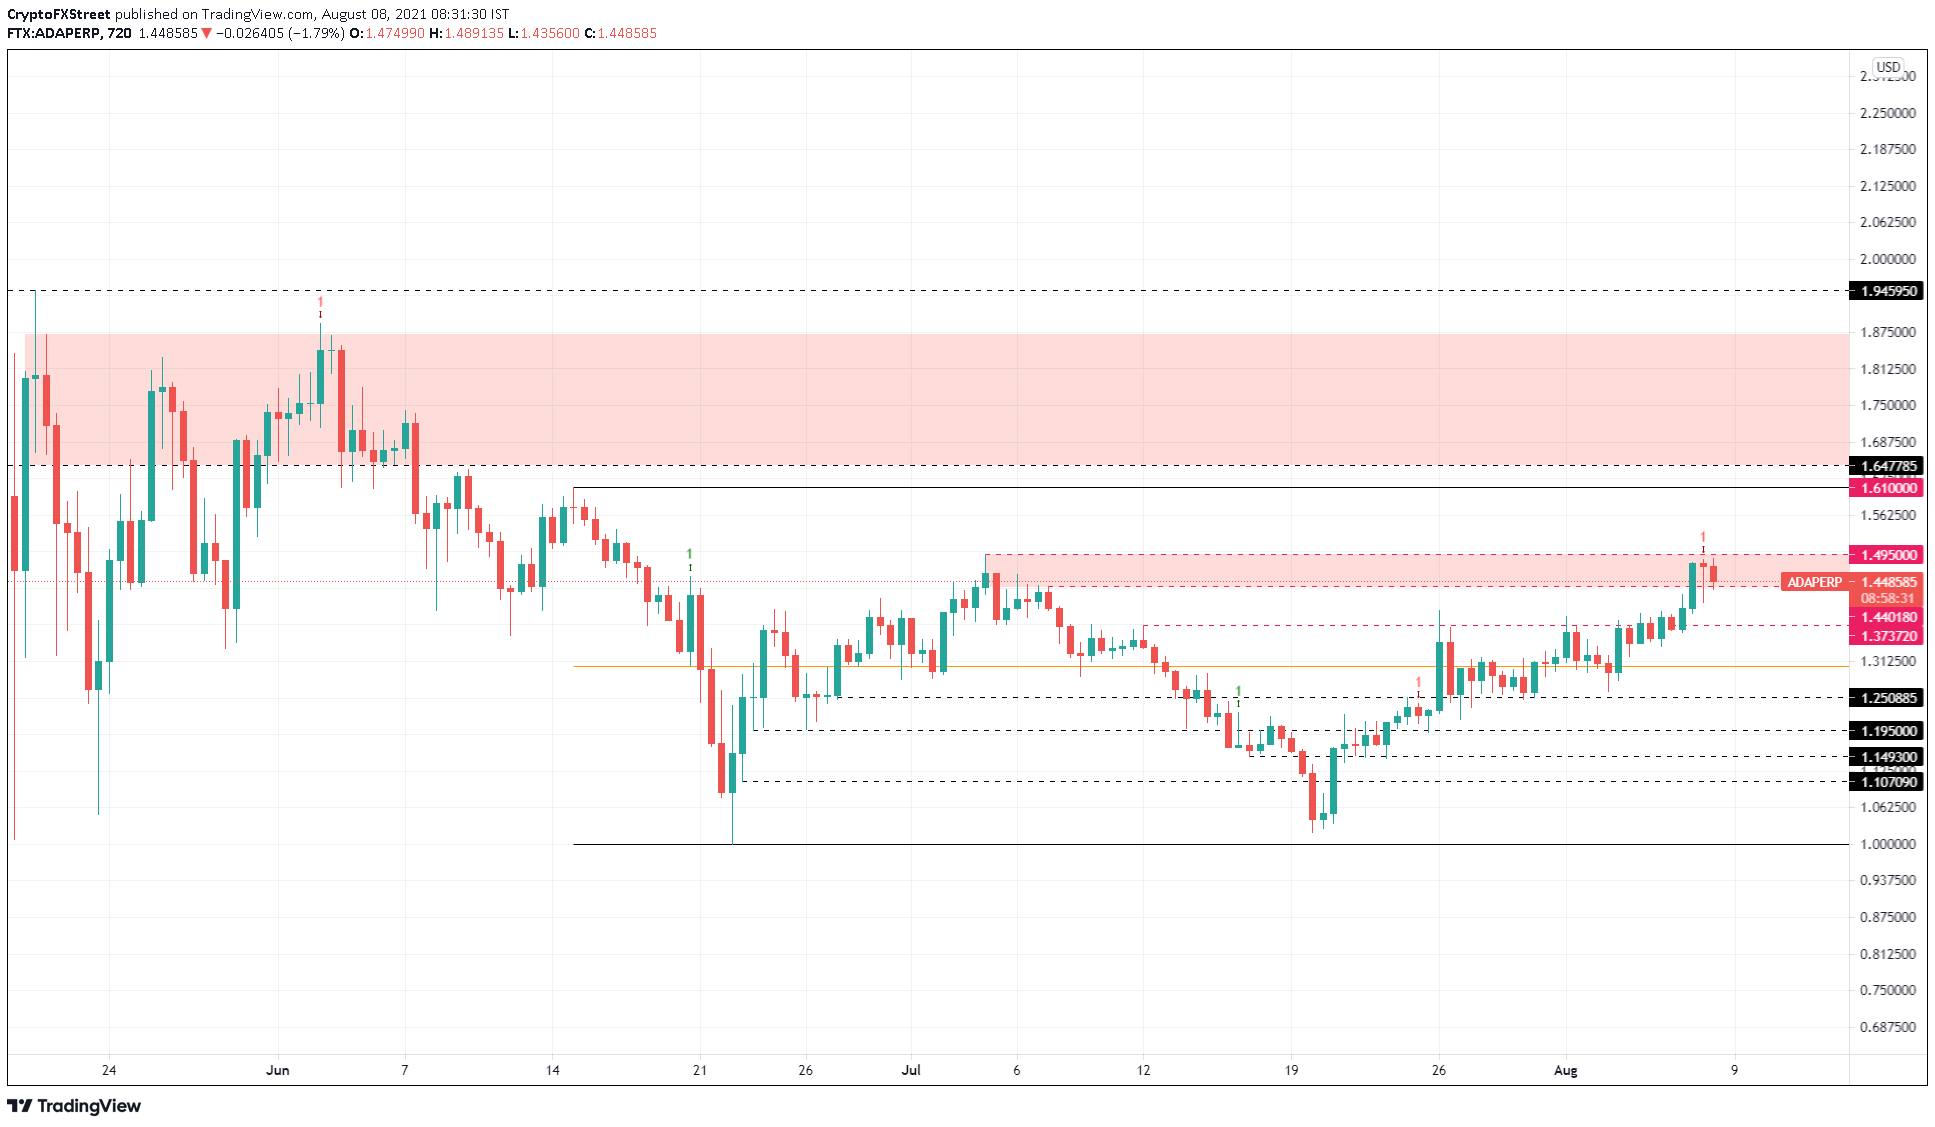
ADA/USDT 12-hour chart
While an upswing might likely originate from $1.304, a failure to do so might turn the situation grim and push Cardano price down to $1.251. This development will favor the bears, but the bearish thesis might face invalidation if the bulls ignore the sell signals and push through $1.5.
A decisive 12-hour candlestick close that flips $1.5 level into a support barrier will invalidate the pullback narrative and restart the uptrend.
In such a case, ADA might rally to the next significant level, $1.61.
Author

Akash Girimath
FXStreet
Akash Girimath is a Mechanical Engineer interested in the chaos of the financial markets. Trying to make sense of this convoluted yet fascinating space, he switched his engineering job to become a crypto reporter and analyst.


